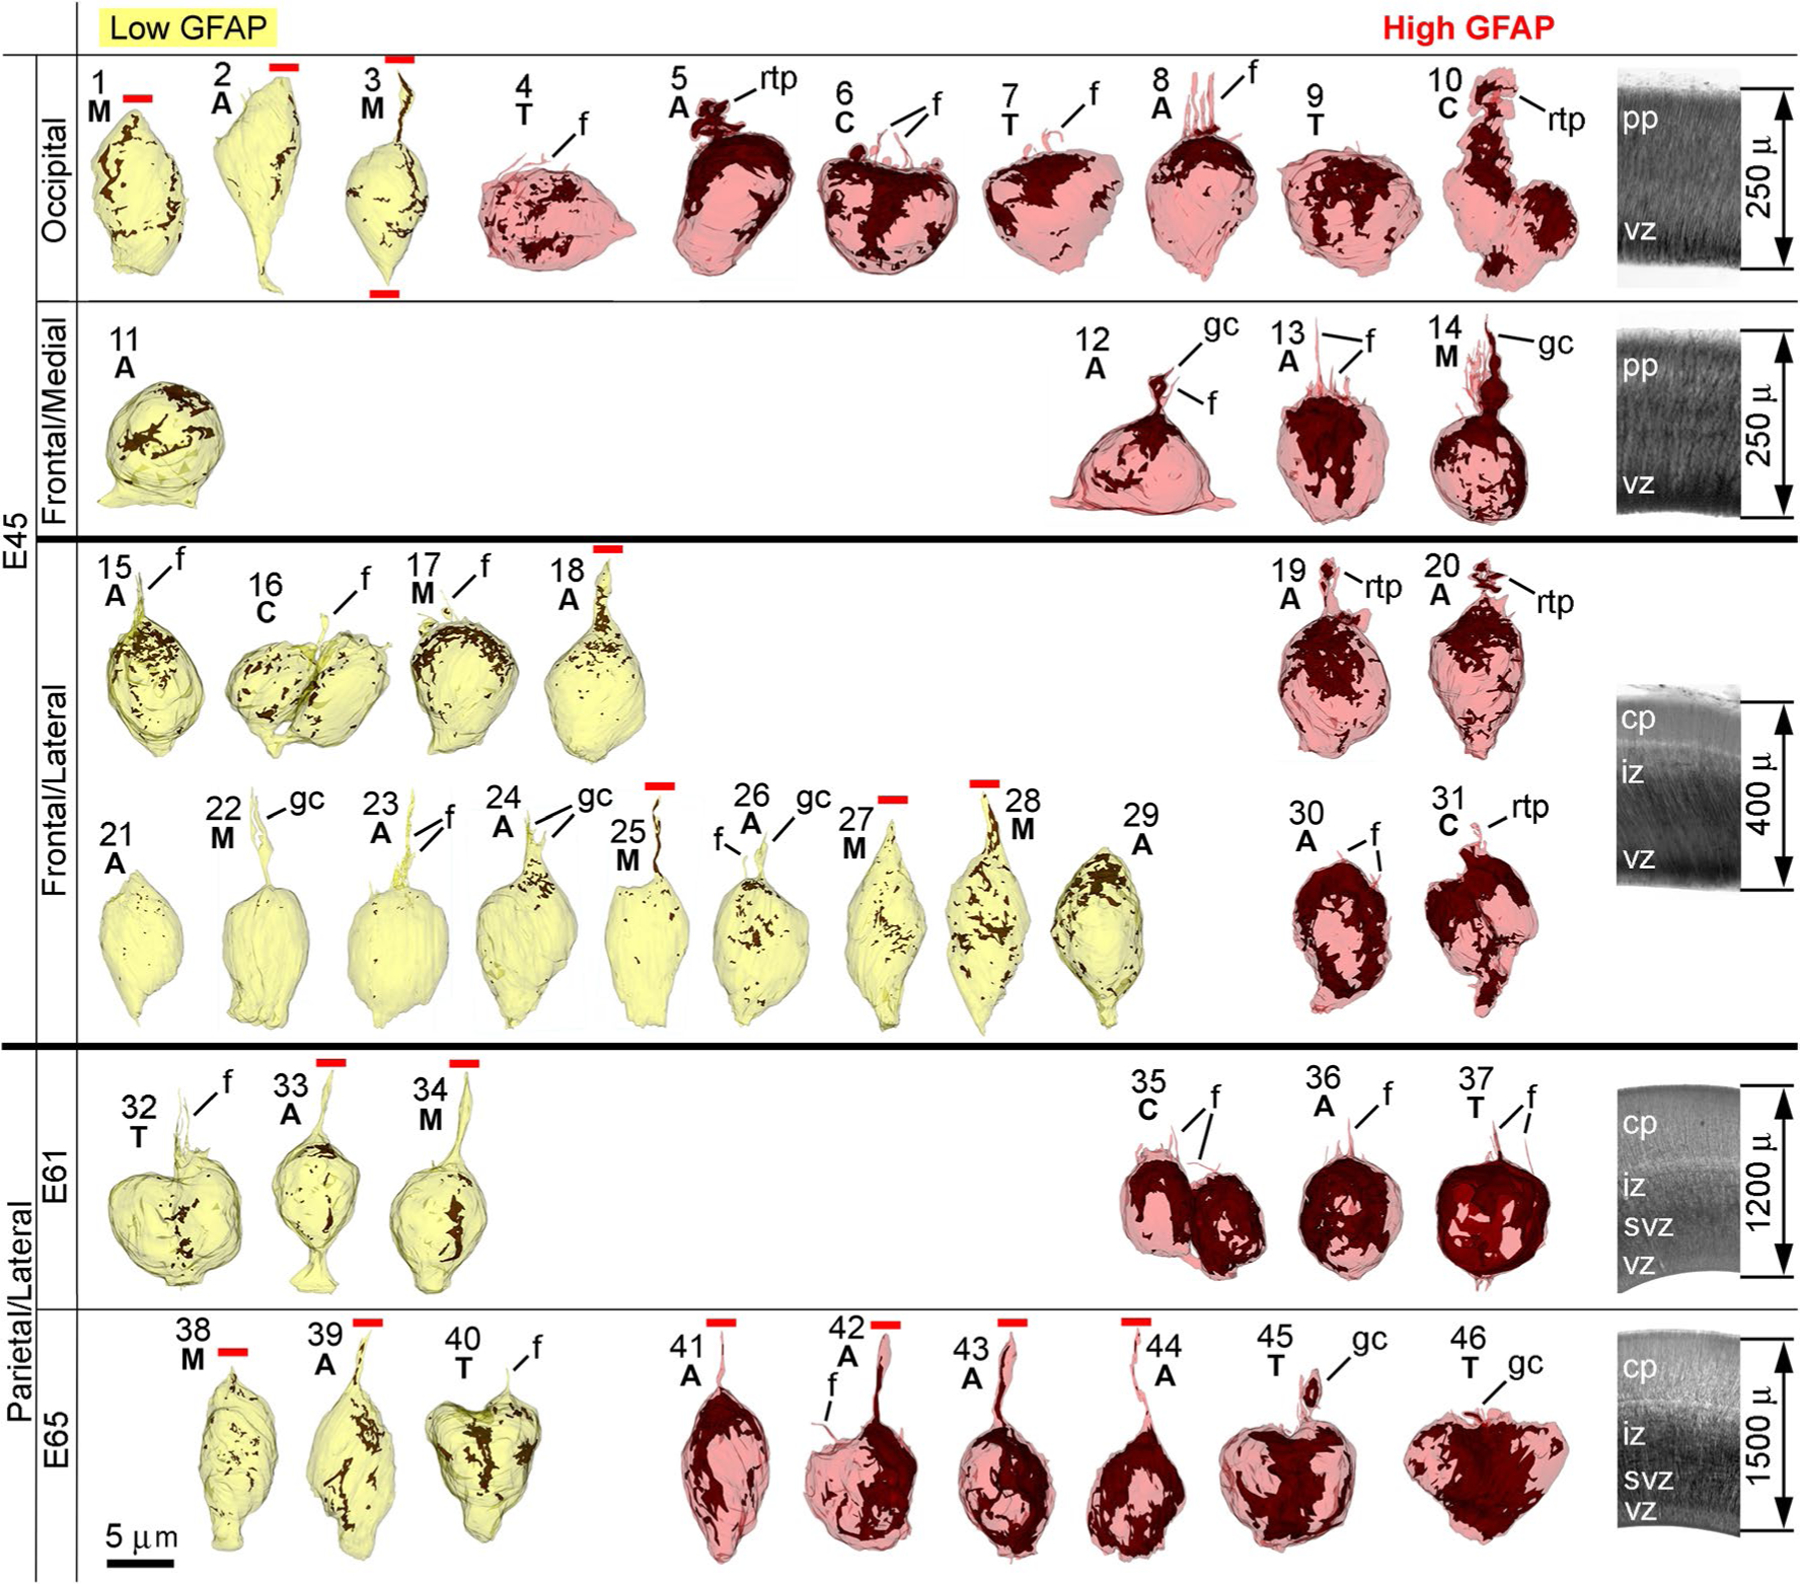
Fig. 3.

Montage of 3D reconstructions of the 46 cells analyzed. Age and cortical regions are indicated in the left side, and images of the cortical layering and thickness in the right side. GFAP immunolabeling is depicted in brown and cells are oriented with the basal segments upwards. Mitotic phases (M metaphase, A anaphase, T telophase, C cytokinesis) are indicated for each cell. Cells are ordered in ascending order of relative volume of GFAP immunolabeling (Table S1). Note the variability in the amount of immunolabeling and the morphology of the basal processes. Cells number 21, 22 and 23 show minute content of GFAP (albeit above background labeling; see Supplementary data for details). Truncated radial processes are indicated with horizontal red lines. Cells may emit growth cone-like processes (gc), retracting-like processes (rtp) or thin filopodia (f) terminated within the analyzed tissue segments. cp cortical plate, iz intermediate zone, pp preplate, svz subventricular zone, vz ventricular zone
