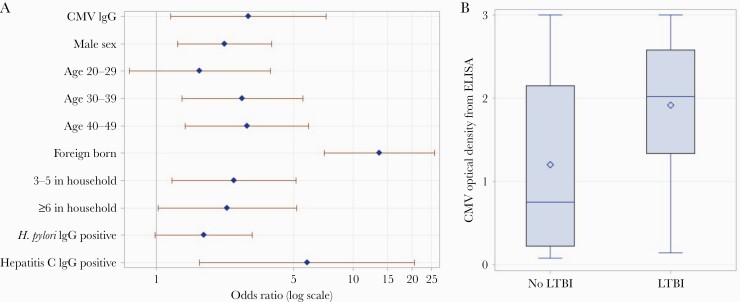
Figure 1.
A, Multivariable logistic regression model assessing the relationship between CMV and LTBI, adjusting for age group, sex, US birth vs foreign birth, household size, H. pylori antibody status, and hepatitis C virus antibody status. Adjusted odds ratios were determined by adjusting for each of the other factors. The marker on the horizontal lines denotes the odds ratio, and horizontal line denotes the 95% CI. The vertical line shows an odds ratio of 1.0. B, Box plot of CMV optical density by LTBI status. The top and bottom box edges denote quartiles, and the line in the box denotes the median. Minimum and maximum values are denoted by ends of lines. Abbreviations: CMV, cytomegalovirus; ELISA, enzyme-linked immunosorbent assay; IgG, immunoglobulin G; LTBI, latent tuberculosis infection.

