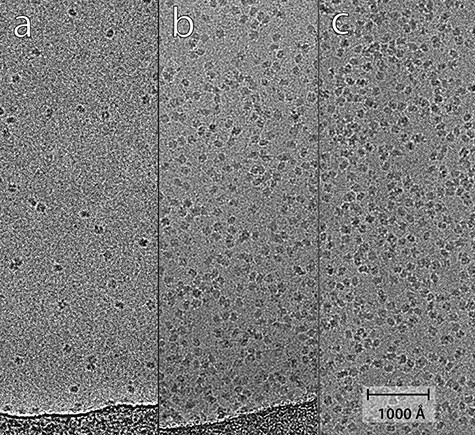
Fig. 2.

Panel showing how the observed number of catalase particles increases with protein concentration: (a) 1 mg/ml, (b) 10 mg/ml, (c) 25 mg/ml, all with 8 mM CHAPSO. A numerical comparison between the number of observed and expected particles per square micron is presented in Results, and shows good agreement.
