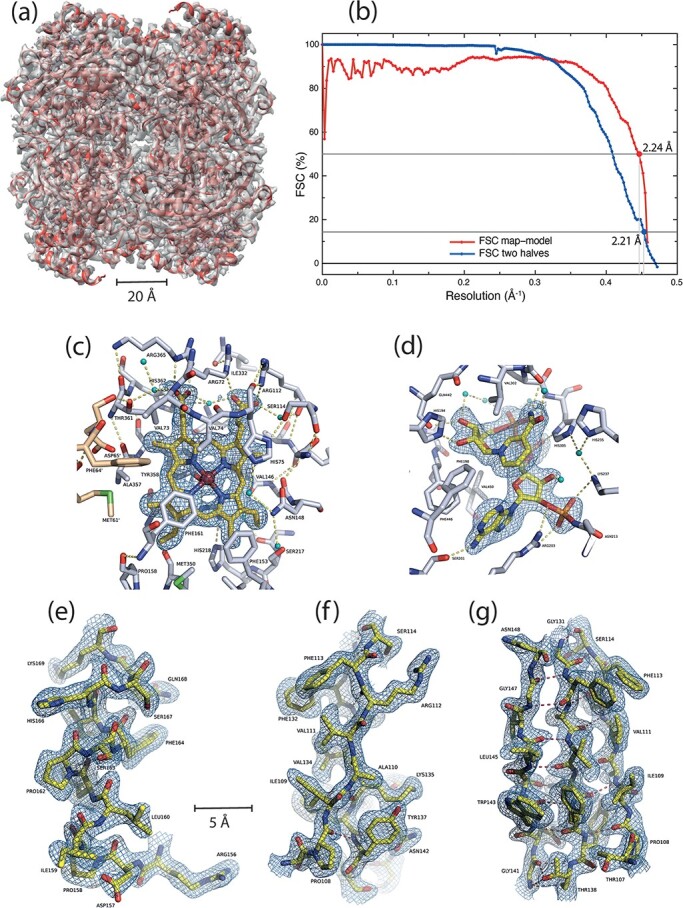
Fig. 4.

CryoEM structure of catalase obtained after minimizing the air–water interaction problem using detergent. (a) Overlay of the final model (shown in cartoon representation in red) and the final sharpened EM map in transparent gray. (b) FSC curves between two halves of data and between map and refined model. Parts of the map and corresponding model are shown: (c) near the heme, (d) at the NADPH ligand-binding site, (e) around α-helix 156–169, (f) side-view of a 3-stranded β-sheet with visible side-chains and (g) front view of the same 3-stranded β-sheet. The small blue-green spheres are water molecules.
