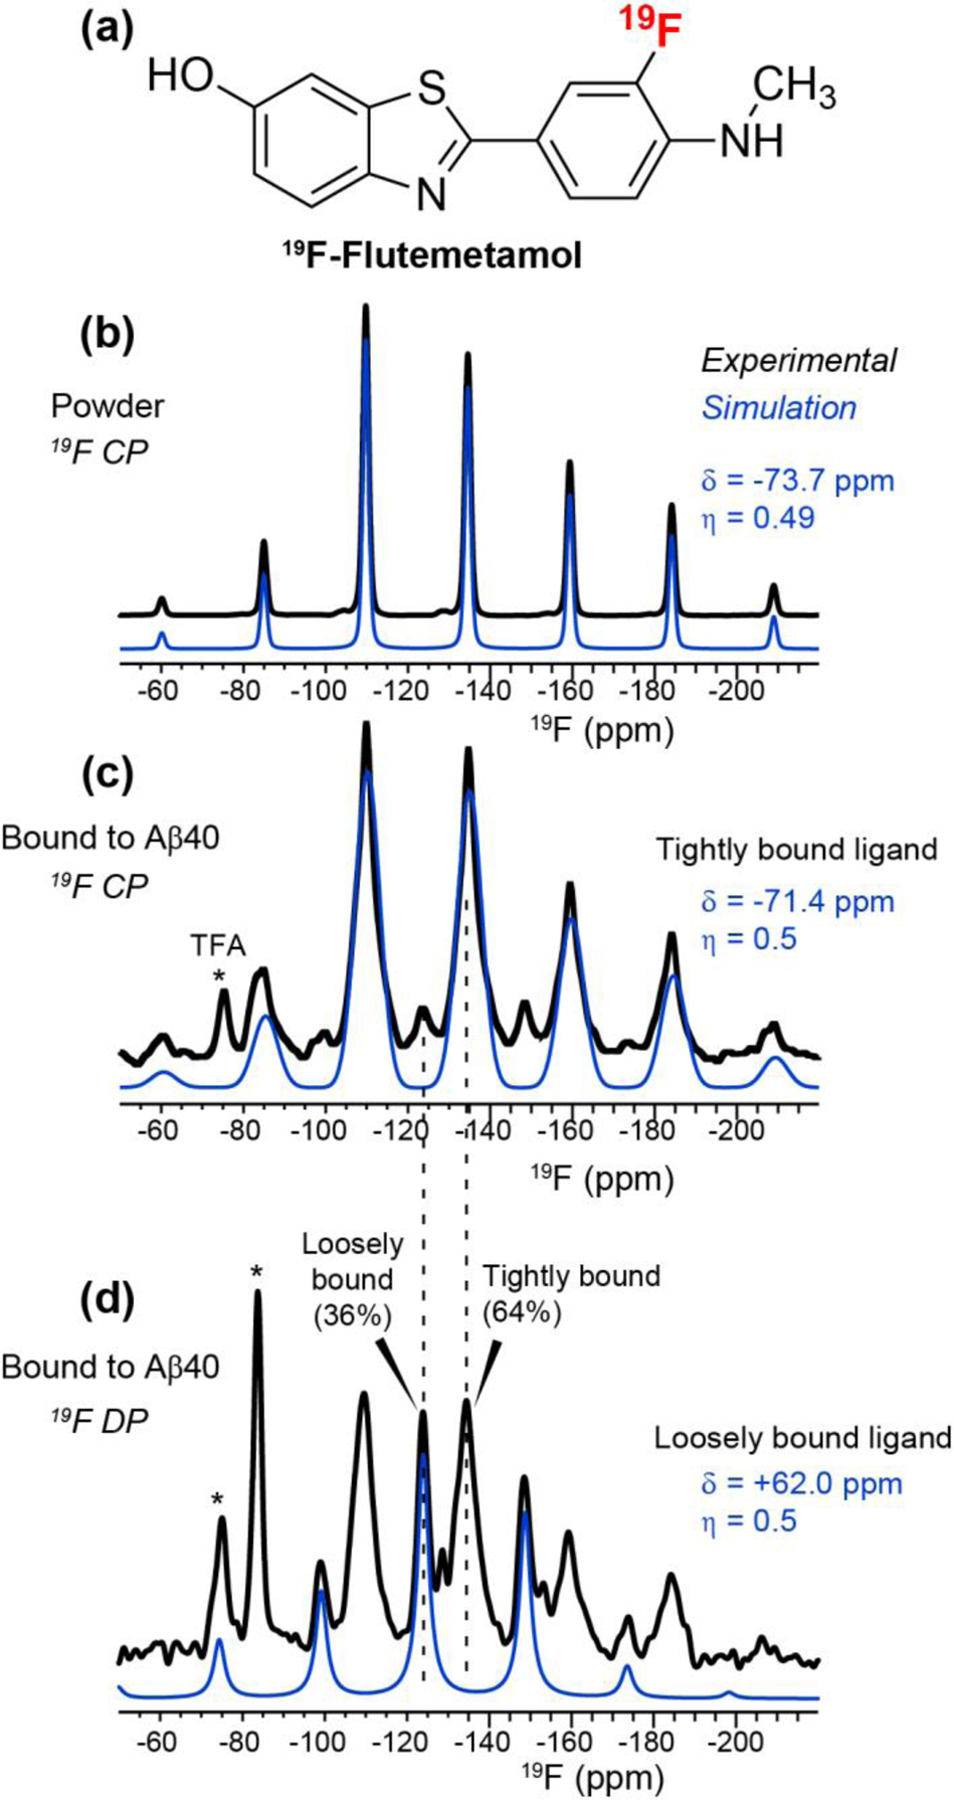
Figure 2.

19F NMR spectra of flutemetamol. (a) Chemical structure of 19F-labeled flutemetamol. (b) 19F CP spectrum of powder flutemetamol, measured with a 40-s recycle delay. Spectral simulation yields a 19F CSA δ of −73.7 ppm and an asymmetry parameter η of 0.49. (c) 19F CP spectrum of Aβ-bound flutemetamol, measured with a 2-s recycle delay. Spectral simulations of the sideband pattern indicate very similar 19F CSA parameters as the powder sample. (d) 19F DP spectrum of Aβ-bound flutemetamol, measured with an 18-s recycle delay. A second component with an isotropic chemical shift of −124.2 ppm is observed, which has a reduced CSA of +62 ppm and narrower linewidth than the −134.8 ppm isotropic component. Asterisks denote residual peptide-bound TFA (−75 ppm) and free TFA (−85 ppm) in the samples. The latter is only detected in the DP spectrum while the former is detected in both the CP and DP spectra. All spectra were measured under 14 kHz MAS.
