
Figure 4.
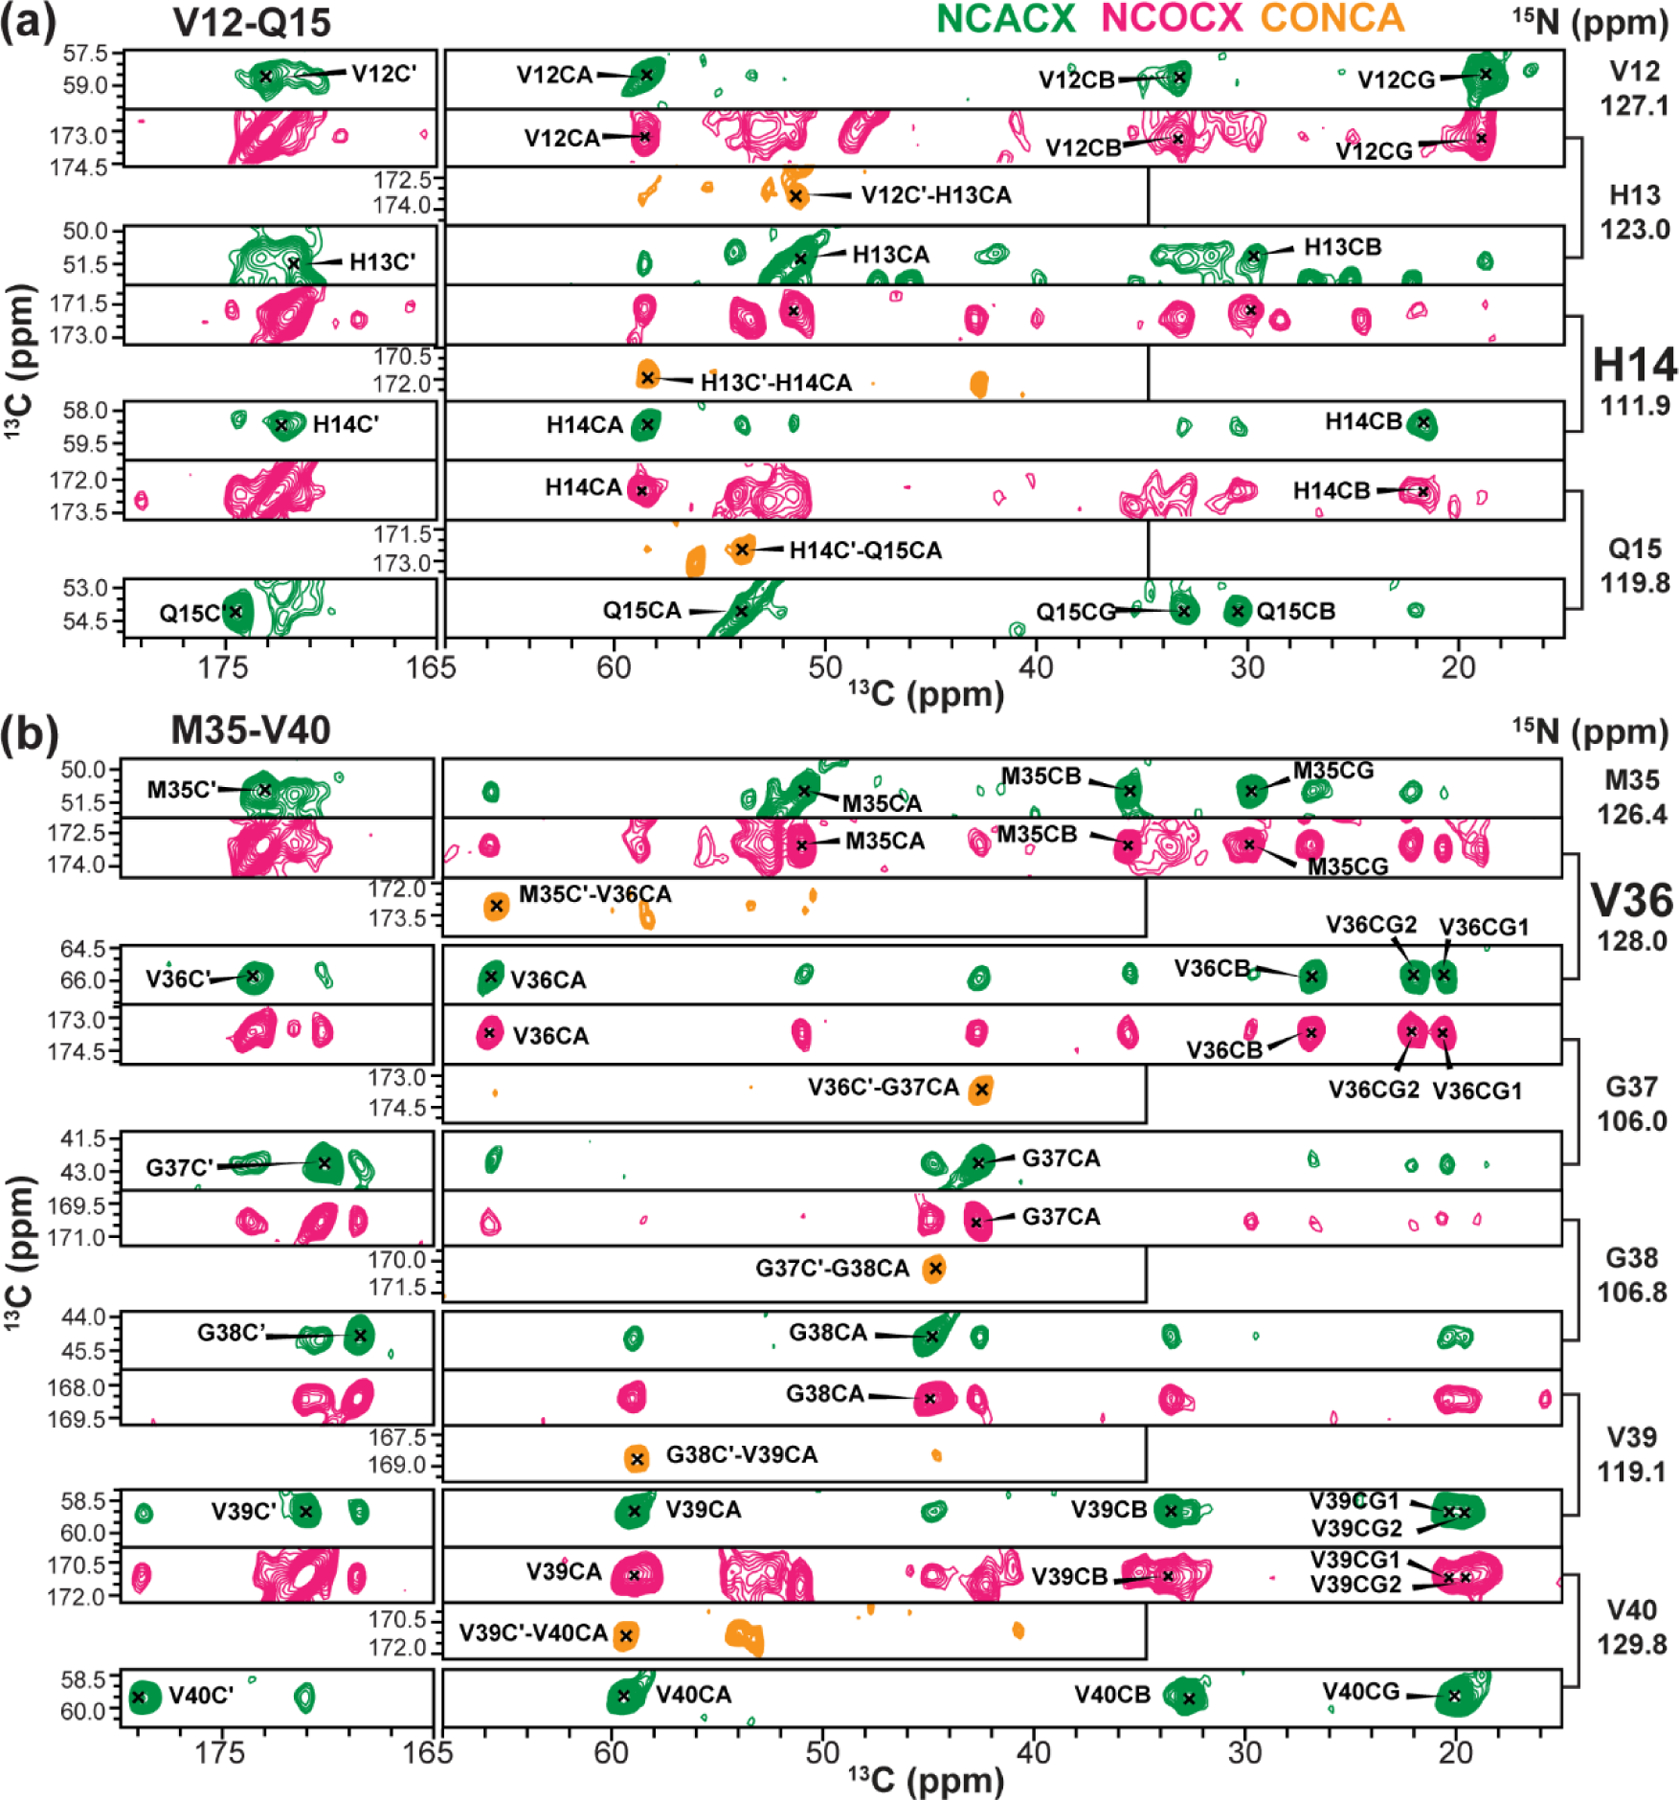
Representative 3D spectral strips for chemical shift assignment of apo Aβ40 fibrils. (a) 12VHHQ15 strip. (b) 35MVGGVV40 strip. Note the α-helical chemical shifts of H14 and V36. The NCACX spectrum provides intra-residue correlation peaks whereas the NCOCX and CONCA spectra provide inter-residue correlations.