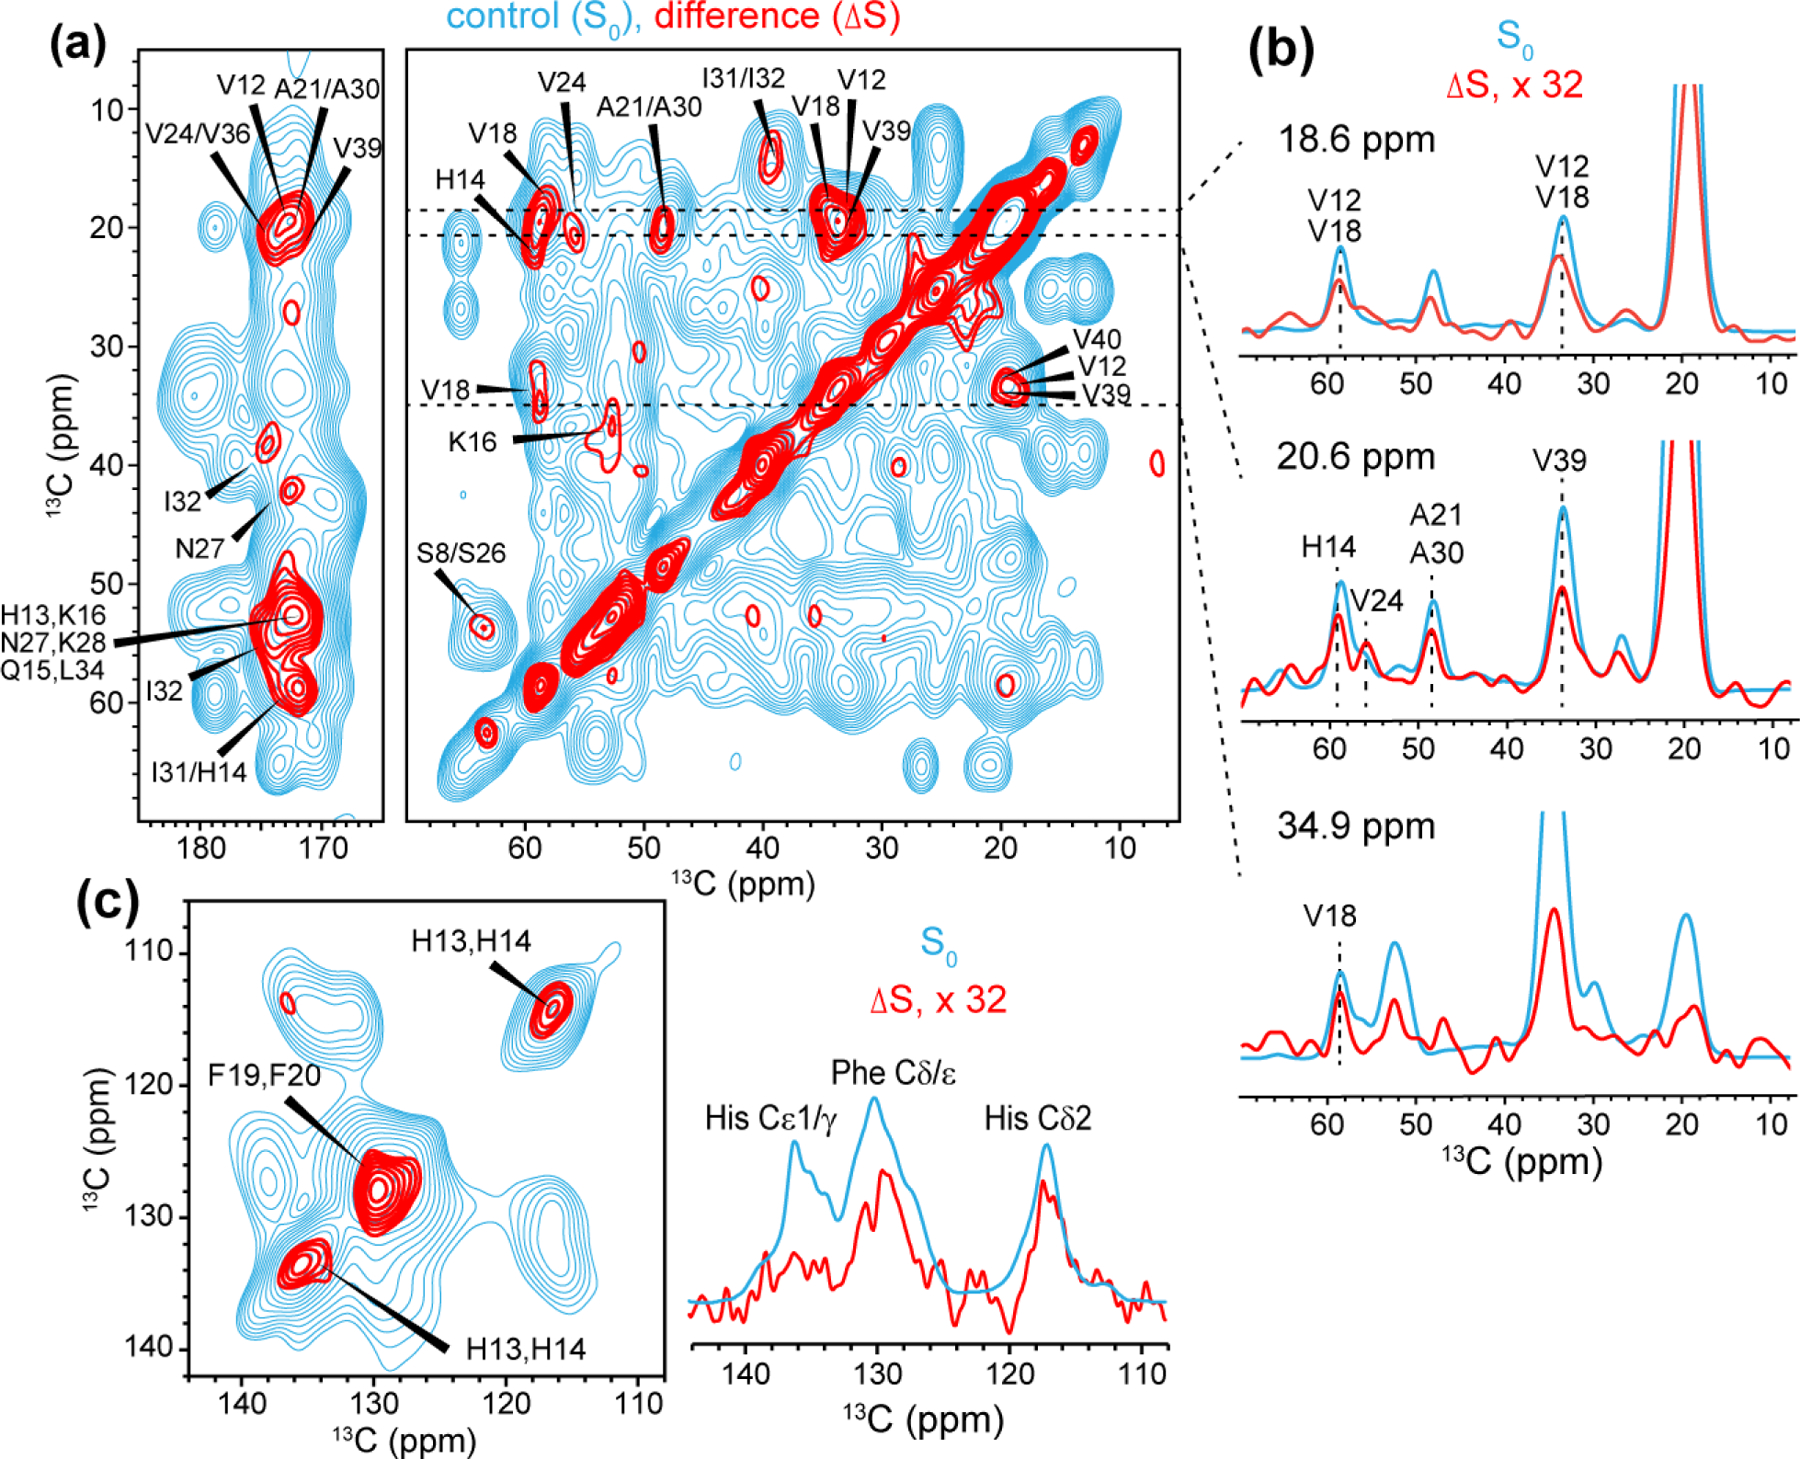
Figure 6.

2D 13C-13C resolved 1H-19F REDOR S0 (cyan) and ΔS (red) spectra for determining residues in close proximity to flutemetamol. The REDOR mixing time was 2.3 ms. (a) Aliphatic and carbonyl regions. (b) Selected 1D cross sections. The ΔS spectrum is scaled up 32-fold to facilitate comparison with the S0 spectrum. These REDOR spectra are significantly line-broadened (LB = −30 and GB = 0.02) to maximize the signal-to-noise ratios. (c) Aromatic region of the 2D spectrum (left). The 1D 13C-detected 1H-19F REDOR spectra are shown on the right. Both spectra were measured using a mixing time of 2.3 ms and gave consistent results.
