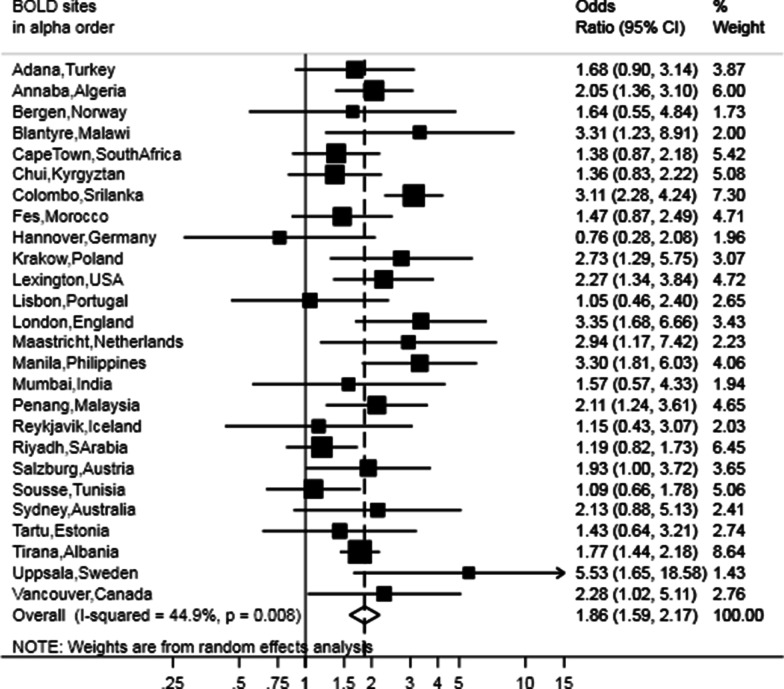
Fig. 4.
Forest plot showing the meta-analysis of the adjusted odd ratios for hypertension in participants with restricted spirometry compared to those without it adjusted for sex, age, BMI, smoking (pack-years and current status) and education. Heterogeneity chi-squared = 28.29, d.f. = 31 (p = 0.606). I-squared (variation in ES attributable to heterogeneity) = 0.0%. Estimate of between-study variance Tau-squared = 0.0000. Test for overall effect: Z = 9.94 (p < 0.001). The following sites could not be included in the analysis due to a low number of subjects reporting hypertension: Ife (Nigeria)

