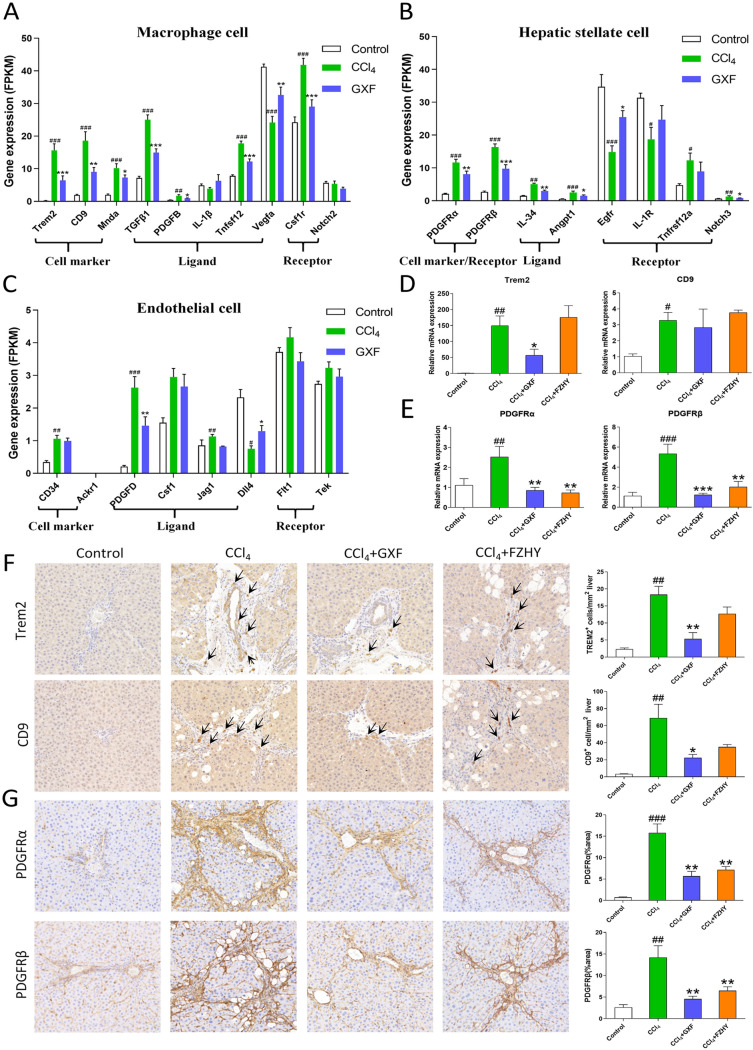
Fig. 6.
GXF reduced the proliferation and activation of SAMacs and SAMes. A-C scRNA-seq combined with RNA-seq to analyze the expression of genes in macrophages, endothelial cells and HSCs. Gene expression level was measured in FPKM value. D The mRNA expression of Trem2 and CD9 were evaluated by RT-qPCR. E The mRNA expression of PDGFRα and PDGFRβ were evaluated by RT-qPCR. F Immunohistochemical staining of liver Trem2 and CD9 levels (× 200). G Immunohistochemical staining of liver PDGFRα and PDGFRβ levels (× 200). The data are presented as means ± SEM (n = 4). #p < 0.05, ##p < 0.01, ###p < 0.001 compared with control group; *p < 0.05, **p < 0.01, ***p < 0.001 compared with CCl4 group

