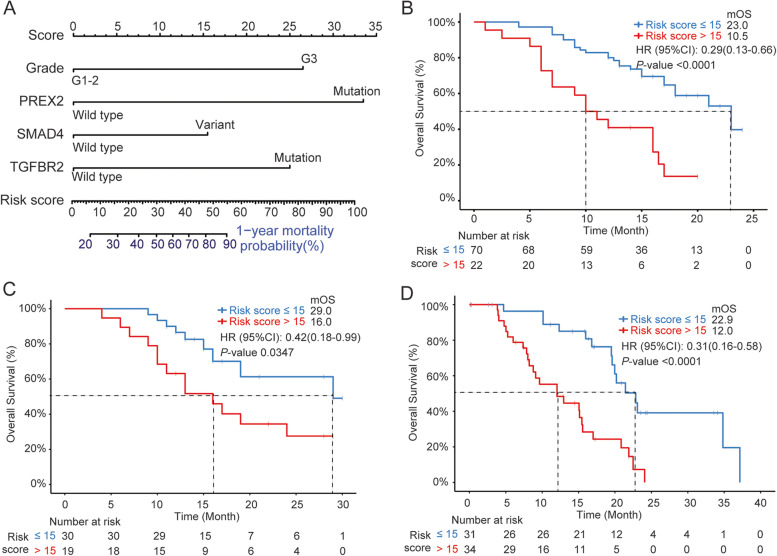
Fig. 2.
Nomogram for risk score calculation and its performance validation. A The nomogram calculating the risk score of one-year mortality probability based on the selected four features. The status of each feature corresponds to the score on the top panel. The risk score is the sum of the scores corresponding to each feature which then represents the one-year mortality probability according to the scale bars. The risk score of 15 is the cutoff of the high and low risk groups. The overall survival (OS) curves of patients with high (> 15, red) and low (≤ 15, blue) in the Chinese training cohort (B), Chinese validation cohort (C), and the TCGA cohort (D) are shown. Median OS (MOS), HR (95% CI), and P-value are labeled on the right-up corner of each figure

