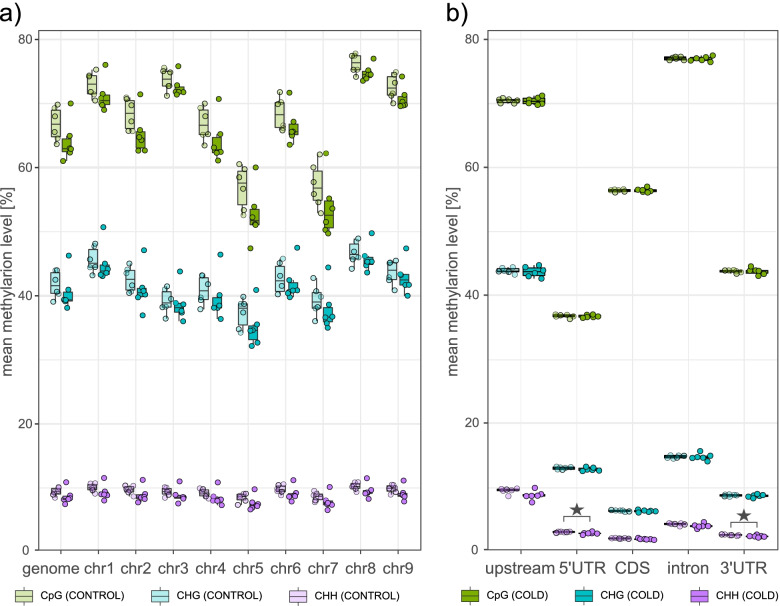
Fig. 2.
Methylation levels in the genome and in gene components under control conditions or after exposure to cold. Global methylation levels of individual chromosomes, the entire genome (panels on the left), or within gene components (panels on the right). Different colors indicate methylation levels of cytosines in different sequence contexts (CpG, CHG, CHH), with lighter shades representing methylation levels of CONTROL and saturated shades representing those of COLD, respectively. Asterisks indicate significant differences (p-value ≤ .05; two-tailed Welch’s test) between methylation levels of CONTROL and COLD. (See also: Additional File 1, Supplementary Fig. S1 for feature methylation levels per chromosome, and Additional File 1, Supplementary Fig. S2 for methylation levels of transposable elements)

