Fig. 3.
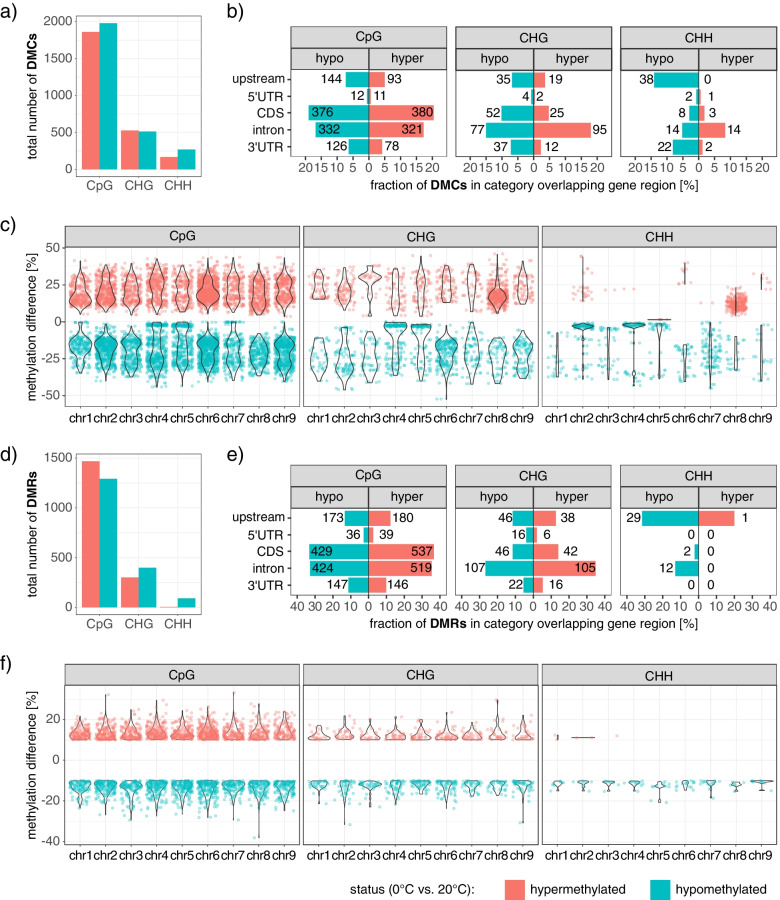
Distribution and characteristics of differentially methylated cytosines (DMCs), or differentially methylated regions (DMRs). a & d Total numbers of all hyper- (red) or hypomethylated (cyan) DMCs (q-value ≤ .05; panel a) or DMRs (with a minimum absolute methylation difference of 10% between CONTROL and COLD; panel d). b & e Fraction of hypermethylated (red) or hypomethylated (cyan) DMCs (b), or DMRs (e) in CpG, CHG or CHH context overlapping an upstream region (2.5 kb upstream of TSS), 5’UTR, CDS, intron or 3’UTR. Percentages (x- axis) refer to the fraction of associated DMCs (or DMRs) compared to all DMCs (or DMRs) of the same context and the same direction of change in methylation, respectively. Numbers indicate the count of differentially methylated positions or regions constituting the corresponding bar. c & f Distribution of differential methylation at single positions (c) or extending over multiple cytosines within the same sequence context in larger DNA stretches (f) over the chromosomes of Beta vulgaris. Position along the y-axis indicates the difference in methylation between CONTROL and COLD

