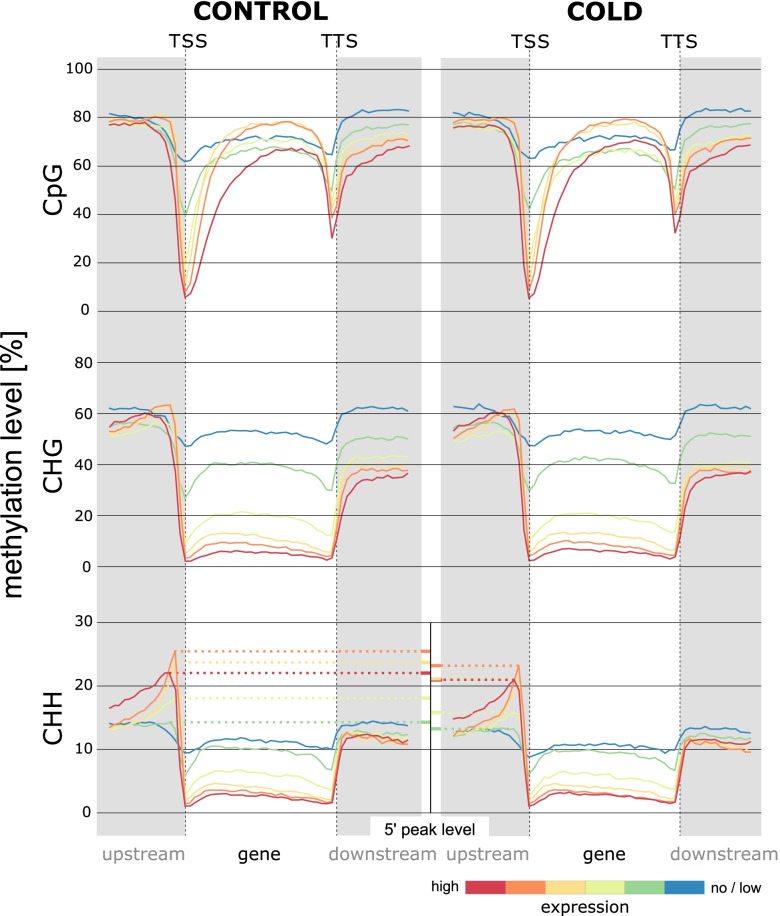
Fig. 4.
Methylation profiles along lowly or highly expressed genes. Profile plots depict data corresponding to methylation and expression in one (representative) sample of CONTROL (profiles on the left), or of COLD (profiles on the right). Genes were ranked and assigned to one of six categories (color-coded) based on their expression level (FPKM; i.e. after normalizing for gene lengths) in a given sample. All genes were split into 30 windows (TSS to TTS, including introns) and window-averages of all genes within the same category (i.e. with similar expression levels) are plotted as an individual line profile, overall depicting the distribution of methylation for groups of lowly, intermediate (orange to green) or highly expressed genes. Gene flanks extend another 15 windows (half the gene length) 5′ of the TSS (upstream) or 3′ of the TTS (downstream), respectively. The inset in the lower panel (between CHH profiles of CONTROL and COLD) compares peak levels of mCHH (5′ region of genes), to illustrate decreased mCHH levels of the COLD sample throughout different expression categories

