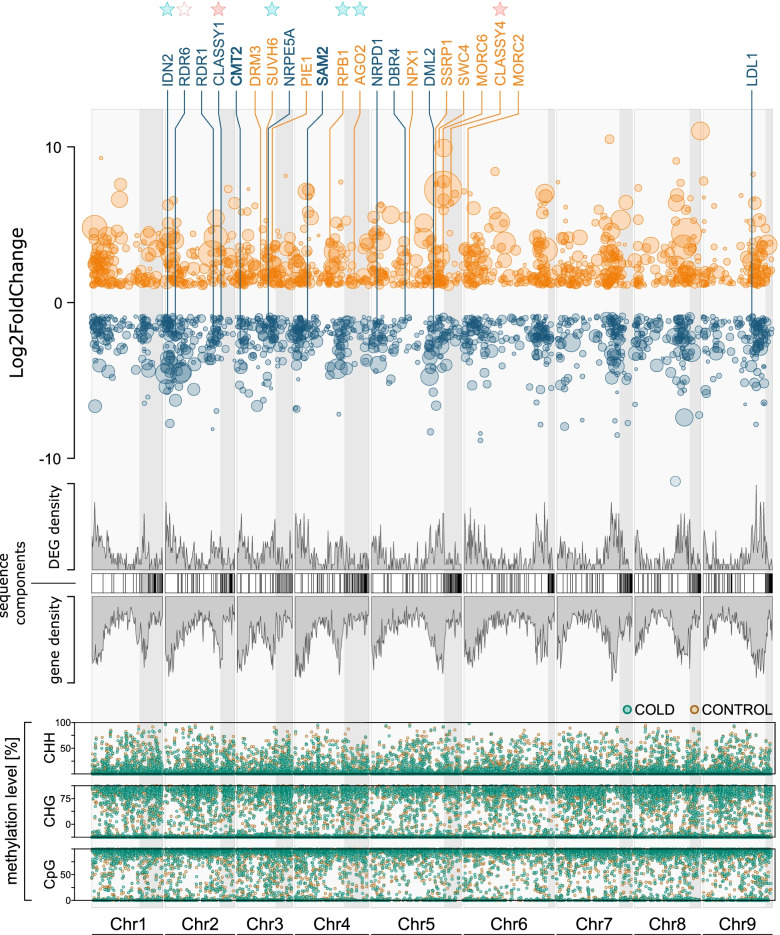
Fig. 5.
Differential gene expression in Beta vulgaris in response to cold exposure. Scatterplot depicting changes in expression (Log2FoldChange) and chromosomal positions for all differentially expressed genes (DEG; padj ≤ .05, Log2FoldChange ≥1 or ≤ − 1) between CONTROL and COLD. Genes, whose expression was significantly upregulated in cold-treated sugar beets compared to the control, are depicted in orange. Those whose expression was significantly downregulated, are depicted in blue. Dot size indicates significance (padj), with larger dots representing higher significance (i.e. lower padj). Labels indicate DEGs related to DNA methylation or demethylation. Densities (grey) correspond to those of all DEGs, or of all predicted genes [44, 50] in 0.5 Mbp windows. Sequence components constituting (pseudo-) chromosomes of the reference sequence (RefBeet-1.2.fna.gz, [22] downloaded from ‘The Beta vulgaris Resource’, [50]) are shown as blocks, with white blocks representing localized scaffolds (known position and orientation within chromosome) and grey boxes representing unlocalized scaffolds (assigned to a chromosome but precise position and/or orientation unknown), the latter being shaded in light grey over the whole plotting area. Asterisks highlight (de)methylation related DEGs overlapping with hyper- (red) or hypomethylated (cyan) DMRs (filled) or DMCs (hollow) – all overlapping DMRs or DMCs could be assigned to cytosines in CpG context. Lower panels show average methylation levels of CONTROL or COLD at 1000 randomly selected cytosines per chromosome and context

