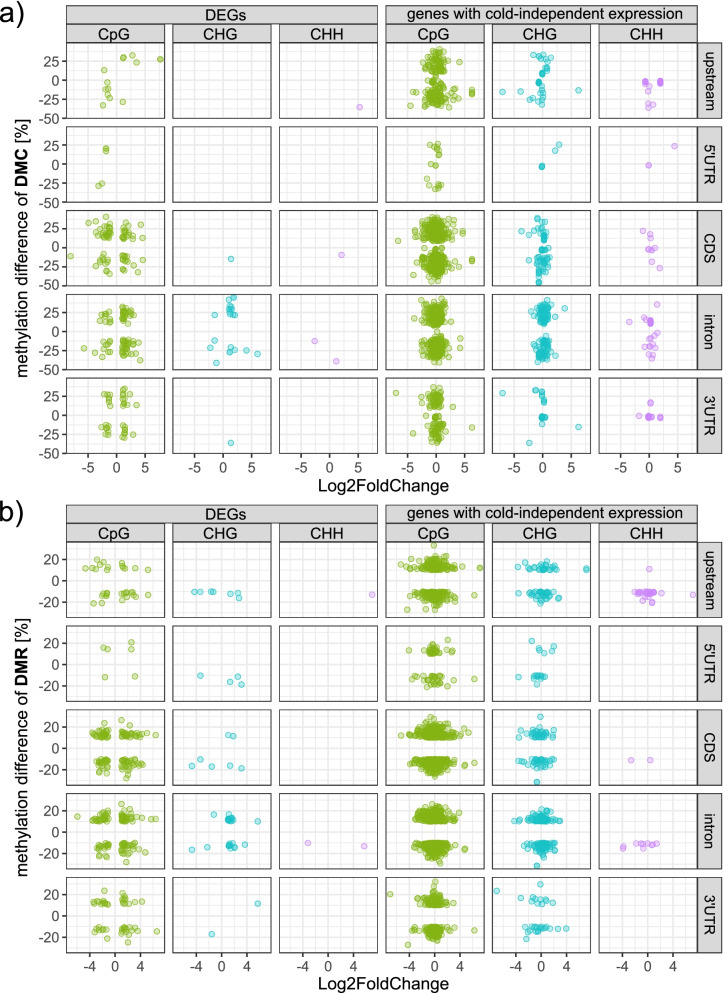
Fig. 6.
Association between changes in expression and changes in methylation. a & b Plots depicting correlations between changes in methylation (methylation difference) and changes in expression (Log2FoldChange), for (a) DMCs or (b) DMRs overlapping an annotated gene. Panels on the left show association of DMCs/DMRs with DEGs, panels on the right correspond to DMC−/DMR-overlaps with genes, whose expression was not significantly altered by cold. Different colors indicate differential methylation in the three sequence contexts, with CpG in green, CHG in turquoise and CHH in purple

