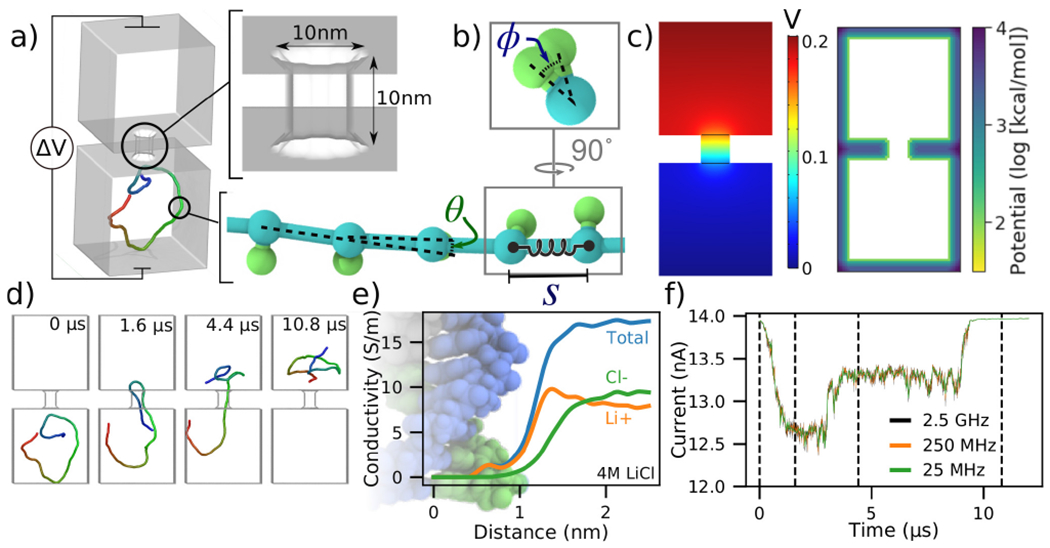
Figure 1:

To-scale modeling of ionic current signatures produced by DNA translocation through a solid-state nanopore. (a) Schematic of a simulation system consisting of two cubic volumes of electrolyte, each with 50 nm sides, connected through a 10 nm-diameter nanopore in a 10 nm-thick membrane. A 500 bp dsDNA molecules is placed in one of the two compartments. A transmembrane bias ΔV = 0.2 V is appled across the membrane. (b) Coarse-grained representation of dsDNA where one or more DNA base pairs are represented by a backbone and an orientation bead [38]. The bond length (S), the bending angle (θ) and the torsion angle (ϕ) are harmonically constrained to reproduce the contour length, the persistence length and the torsional persistence length of dsDNA. (c) Implicit representation of the nanopore membrane consisting of a 3D electrostatic potential map (left) and a steric potential (right). The electrostatic potential shown was computed using COMSOL. (d) Sequence of snapshots illustrating the capture and translocation of a 500 bp dsDNA strand. The DNA molecule is colored blue-to-red from one of its ends to the other. (e) Local conductivity of 4 M LiCl solution as a function of distance to the center of the DNA helix. The local conductivity profiles were derived from analysis of all-atom MD simulations [39]. (f) Ionic current traces corresponding to the DNA translocation trajectory shown in panel d, computed using SEM [33] and the local ion conductivity model shown in panel e. The dashed lines correspond to snapshots shown in panel d. The ionic current traces differ by their sampling rate.
