Figure 2:

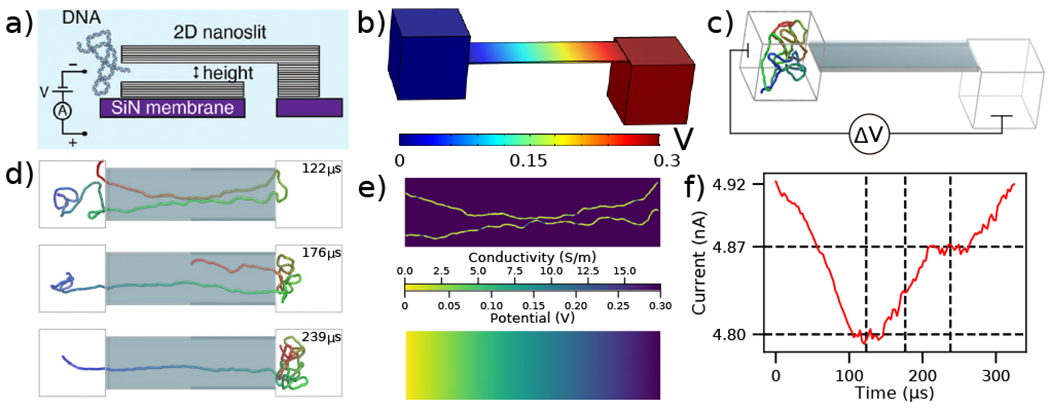
To-scale modeling of the ionic current measured during DNA translocation through a 2D nanoslit. (a) Schematic cross-section of the experimental nanoslit device, reproduced from [35]. Graphene stacks are attached atop a silicon nitride membrane to create a slit with approximate dimensions 400×110×3.5 nm3. (b) Electrostatic potential along the boundaries of the simulation system computed using COMSOL. The slit dimensions are reproduced from experiment while the two 160 nm cubes approximate the experimental entrance and exit reservoirs that DNA translocates between. (c) Initial configuration of the system prior to CG simulations of dsDNA translocation through the 2D nanoslit. Before translocation simulations, each 5000 bp DNA molecule was equilibrated in a 160 nm3 box using a multi-resolution simulation protocol to produce initial conformations. A ΔV = 300 mV bias is applied between the compartments, reproducing the experimental setup [35]. (d) Sequence of snapshots illustrating the process of DNA translocation through the nanoslit. (e) The local conductivity (top) and the local electrostatic potential (bottom) within the center cross-section of the slit for the DNA conformation shown in the top snapshot of panel d. Both quantities were computed using the local conductivity model from Fig. 1e under a 300 mV bias. (f) Ionic current analysis of the DNA translocation trajectory generated using SEM [33]. The vertical dashed lines correspond to the snapshots shown in d, while the horizontal dashed lines indicate the current levels when one or two fragments of the DNA molecule span the entire slit end-to-end. The trajectory was sampled at 367 kHz.
