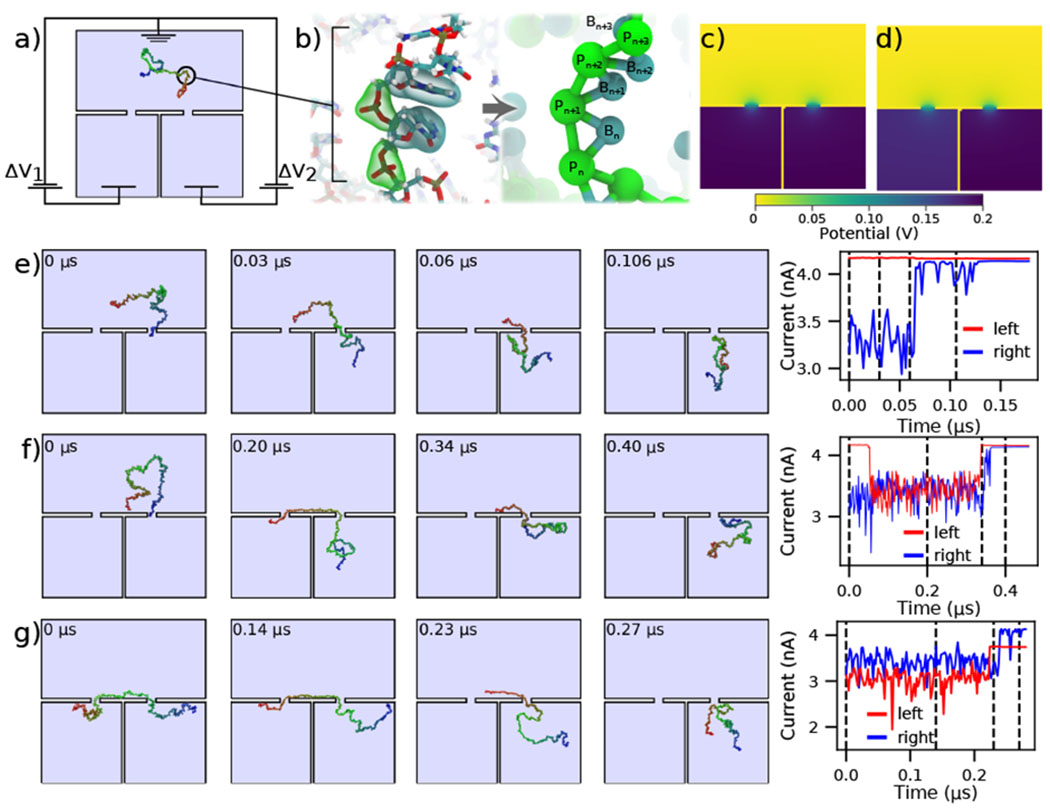
Figure 3:

Modeling capture and translocation of ssDNA in a double nanopore system. (a) A previously described double nanopore system [43], consisting of two identical pores of 1 nm radius and length, separated by 15 nm. The nanopores lead to separate volumes which are separated by a 1 nm thick wall. Here, we consider a situation where the voltage bias ΔV1 and ΔV2 in each of the bottom chambers can be independently controlled relative to the top compartment, which is grounded. A 150 nucleotide ssDNA molecule is modeled at two-beads-per-nucleotide resolution. (b) Schematic of the two-beads-per-nucleotide model of ssDNA, adapted from an earlier work [48]. Each nucleotide is represented by a backbone bead P and a base bead B. (c,d) Distribution of the electrostatic potential under conditions of translocation arrest, ΔV1 = ΔV2 = 200 mV (panel c), and directed translocation, ΔV1 = 180 mV and ΔV2 = 200 mV (panel d). (e,f) Single (panel e) and double (panel f) nanopore capture of ssDNA. The simulations begin with one end of the DNA strand captured in the right nanopore. The voltage drop across both pores is 200 mV (panel c). The right panel shows the ionic current through the left and right nanopores for the corresponding simulation trajectory. (g) Directional transport of ssDNA through the double nanopore system. The simulation begins having two ends of ssDNA symmetrically threaded into the two pores. The 20 mV bias differential (panel d) transports the ssDNA molecule from the left compartment to the right. The current through both pores is shown in the right panel. All ssDNA trajectories were taken from Ref. [43]. The current blockades were computed using a custom model of the local electrolyte conductivity (Supporting Information Fig. 2) at 4 M LiCl electrolyte.
