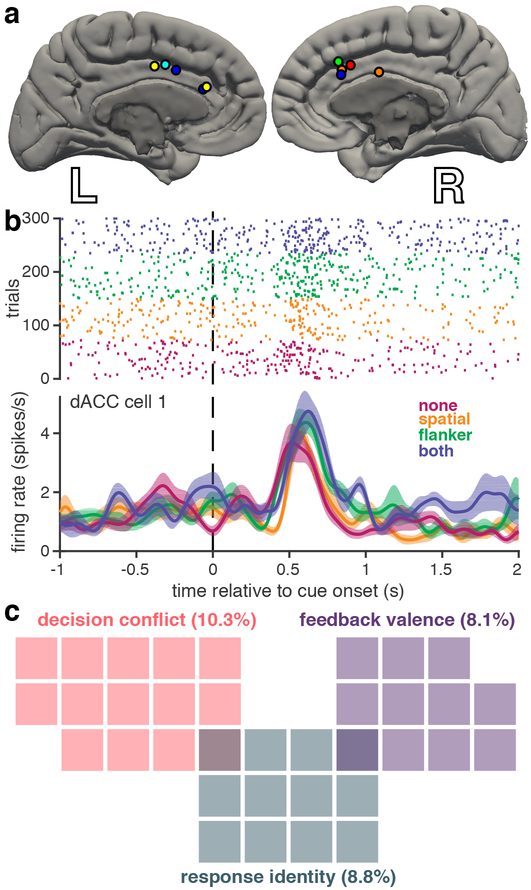
Figure 2. Rate coding of task-relevant variables in human dACC neurons |.
a, Microwire recording locations, with different colors per subject. b, Example dACC raster plot and firing rate over conflict conditions for a representative neuron that shows rate coding for decision conflict. Conflict conditions are color-coded as in Figure 1. Shaded regions represent standard error (n = 72, 77, 85, and 66 trials for none, spatial, flanker, and both conditions, respectively). c, Venn diagram showing only those dACC neurons that were selective for specific task features, as determined by the sliding GLM. Each colored square represents one neuron; percentage of total n = 136 neurons indicated in parentheses.

