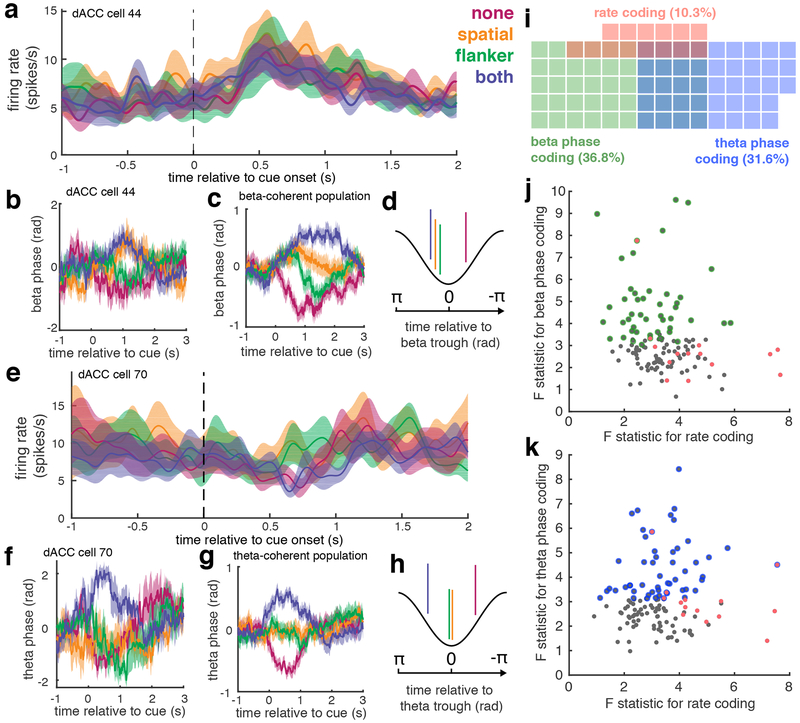
Figure 3. Robust phase coding in dACC neurons |.
a, Example dACC neuron whose firing rate does not vary by conflict level (no firing rate code). b, Mean phase of SFC for a single beta-coherent neuron for each conflict condition. Shaded regions in a, and b represent standard error (n = 72, 77, 85, and 66 trials for none, spatial, flanker, and both conditions, respectively). c, Mean phase of SFC across all beta-coherent neurons color coded by conflict condition (LMM t-test, t510 = 3.6, p = 4*10−4). Shading represents standard error across 50 beta coherent neurons. d, Schematic showing mean spike phase for each conflict condition in beta-coherent neurons. e,f, Same as a,b for a different dACC neuron that again shows no firing rate code, but shows increased theta coherence (N = 69 trials for each conflict condition). g,h, Same as c,d, for theta-coherent neurons (LMM t-test, t510 = 3.1, p = 2*10−3). Shading represents standard error across 43 theta coherent neurons. i, Venn diagram showing only the proportions of neurons that were either beta phase coding (green), theta phase coding (blue), or rate coding (pink) neurons for decision conflict. The proportion of beta- or theta-phase coding neurons was significantly greater than that of rate coding neurons (73 vs 14 neurons; McNemar’s Test, χ2 = 13.5, p < 10−3). j,k, For each neuron, the maximum F statistic from the beta (j) or theta (k) phase code F-statistics plotted against the maximum F statistic from the firing rate GLM (Spearman’s rho for theta: ρ = 0.03; p = 0.76; for beta: ρ = - 0.08; p = 0.32; two-sided t-tests). Scatter plots show statistics for all 136 neurons. Significant rate coding cells are shown in pink, and significant phase coding cells are indicated with colored circles for each frequency range, as in i.

