
Figure 4.
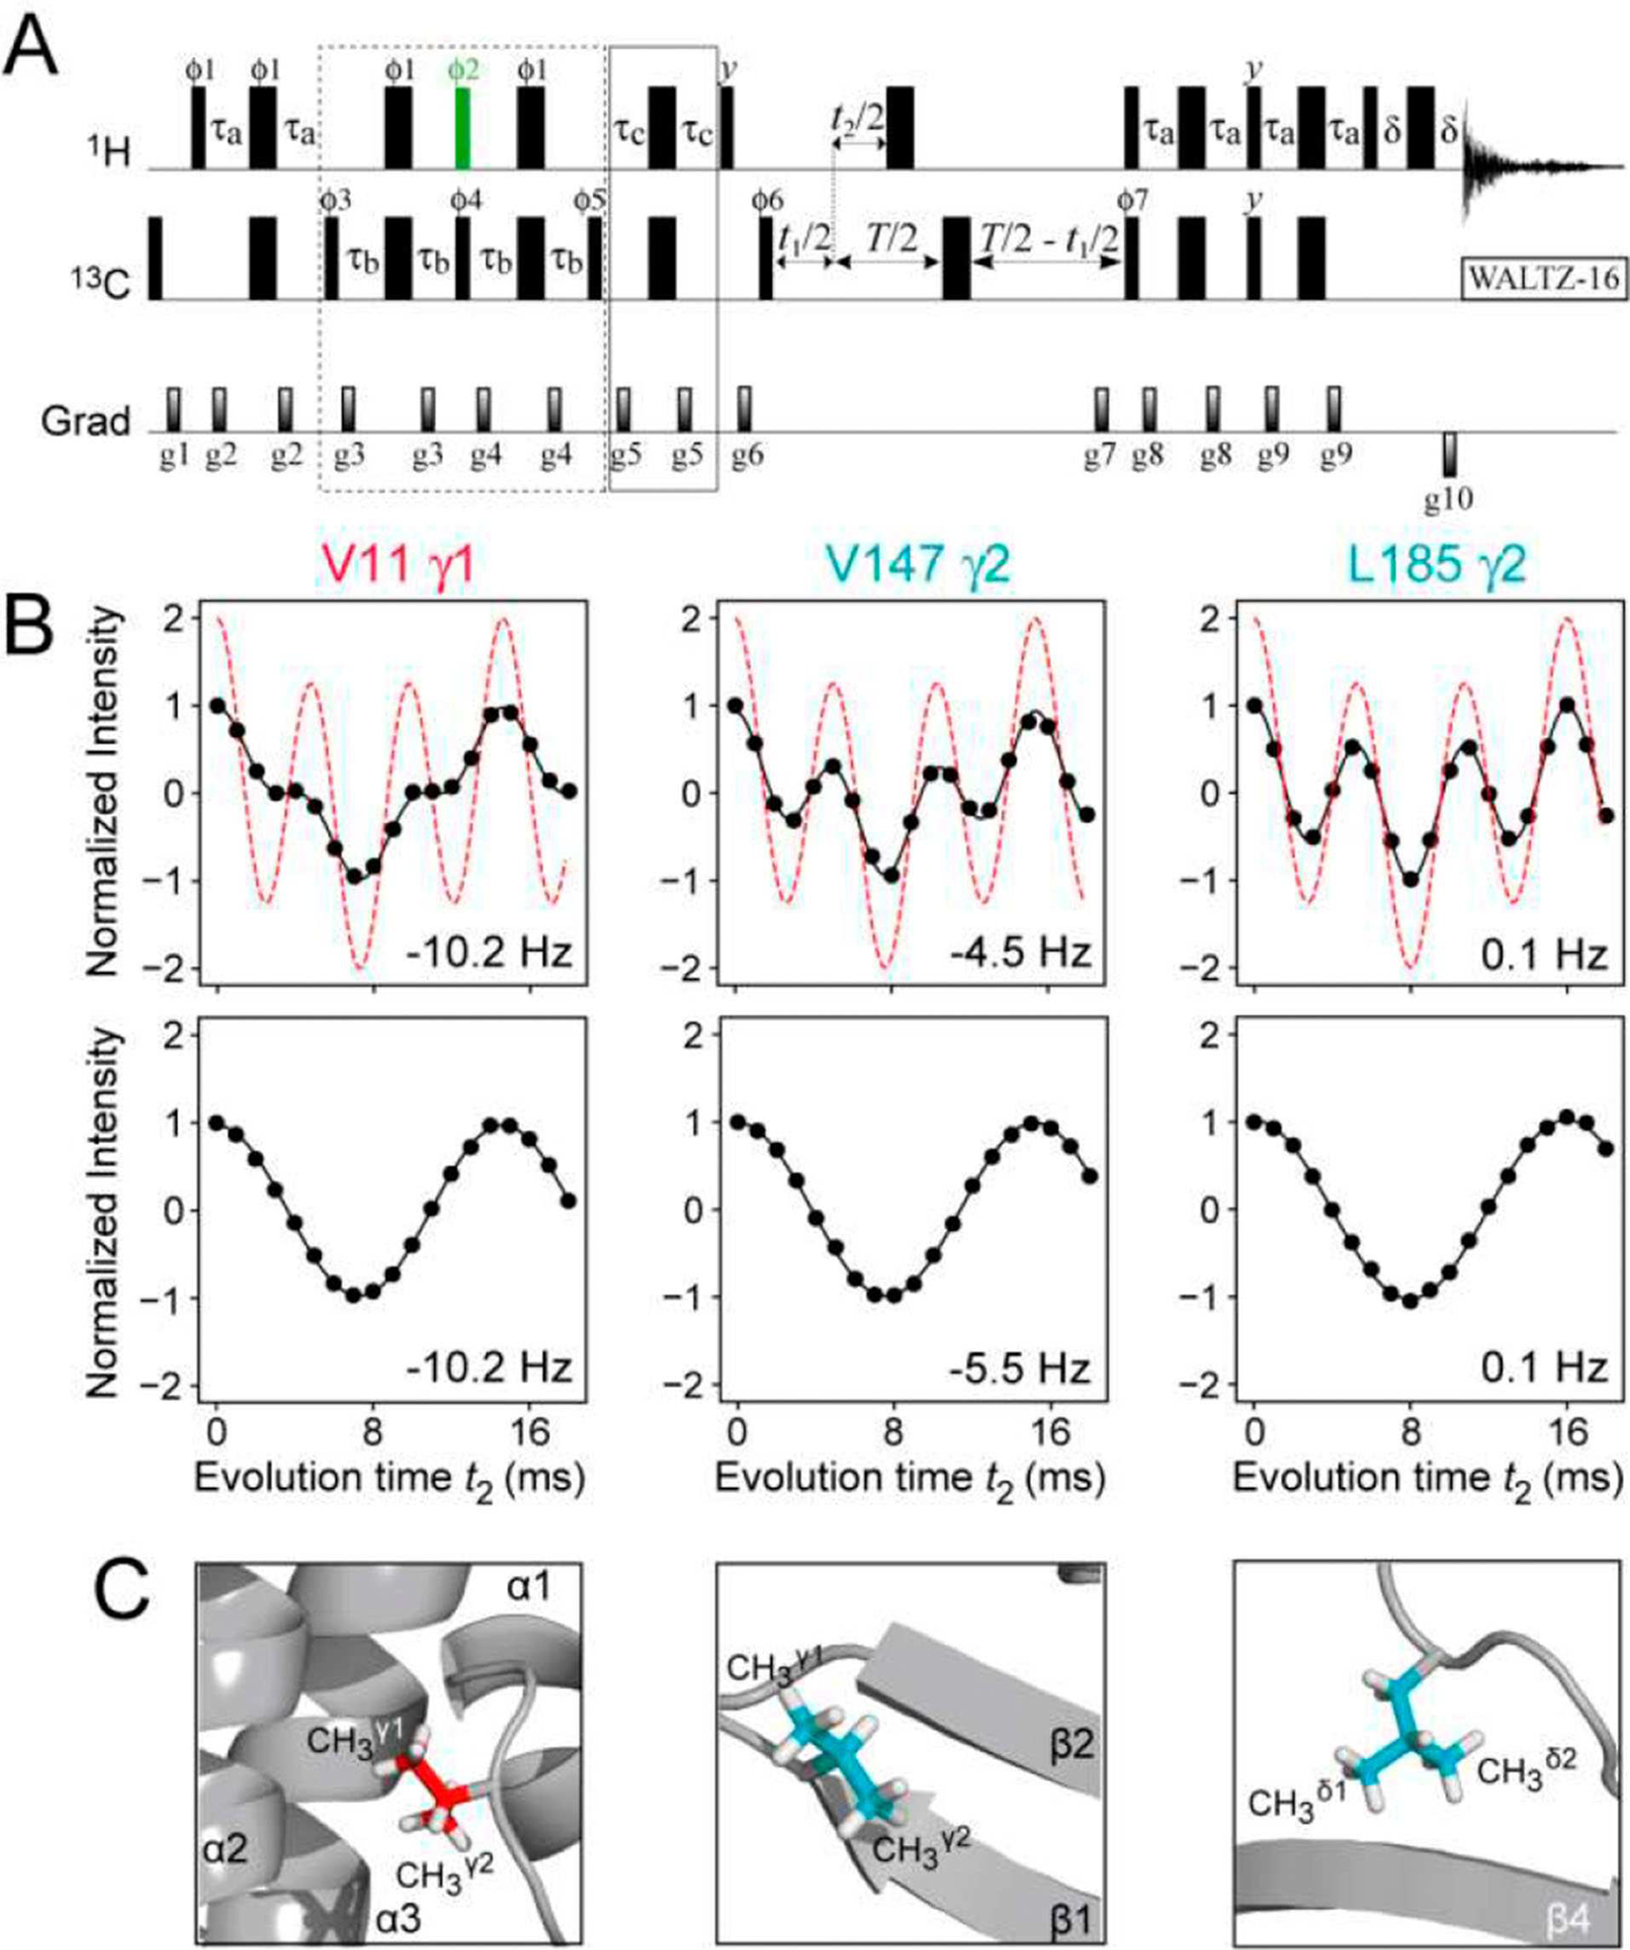
(A) Pulse scheme for the measurement of 1H-13C scalar and residual dipolar couplings in methyl groups of proteins with I=1/2 manifold selection in 13CH3 methyl groups. See SI, Figure S1B, for experimental parameters. A constant-time (CT) delay T=28 ms was used, although sensitivity permitting, any value of T can be used in selectively {13CH3}-labeled protein samples. (B) Plots showing the modulation of the intensity of the 13CH3 correlations in the spectra of {U-[2H]; Ileδ1-[13CH3]; Leu,Val-[13CH3,12CD3]}-labeled ΔST-DNAJB6b (600 MHz; 25°C) recorded using the scheme in panel (A) as a function of the coupling evolution period (t2) without (top row) and with (bottom row) I=1/2 manifold selection. The plot of intensity modulation in the absence of relaxation and without I=1/2 manifold selection is shown with red dashed lines (top row). The data in upper and lower rows are best-fit to the functions, I(t2)=I0{3cos(3πJCHt2)exp(−7RST)+cos(πJCHt2) exp(−RST)} and I(t2)=I0cos(πJCHt2), respectively, where the initial intensity I0, the coupling constant JCH, and the transverse relaxation rate of slow-relaxing carbon coherences RS, are optimized parameters. This function approximately accounts for relaxation of 13C magnetization during the period T. The values of DCH derived from the fits are indicated in each panel. The sample was aligned in 10 mg/mL phage pf1 (see SI for experimental conditions). (C) The locations of the corresponding methyl groups in the structure of ΔST-DNAJB6b are shown in ‘ball-and-stick’ representations.