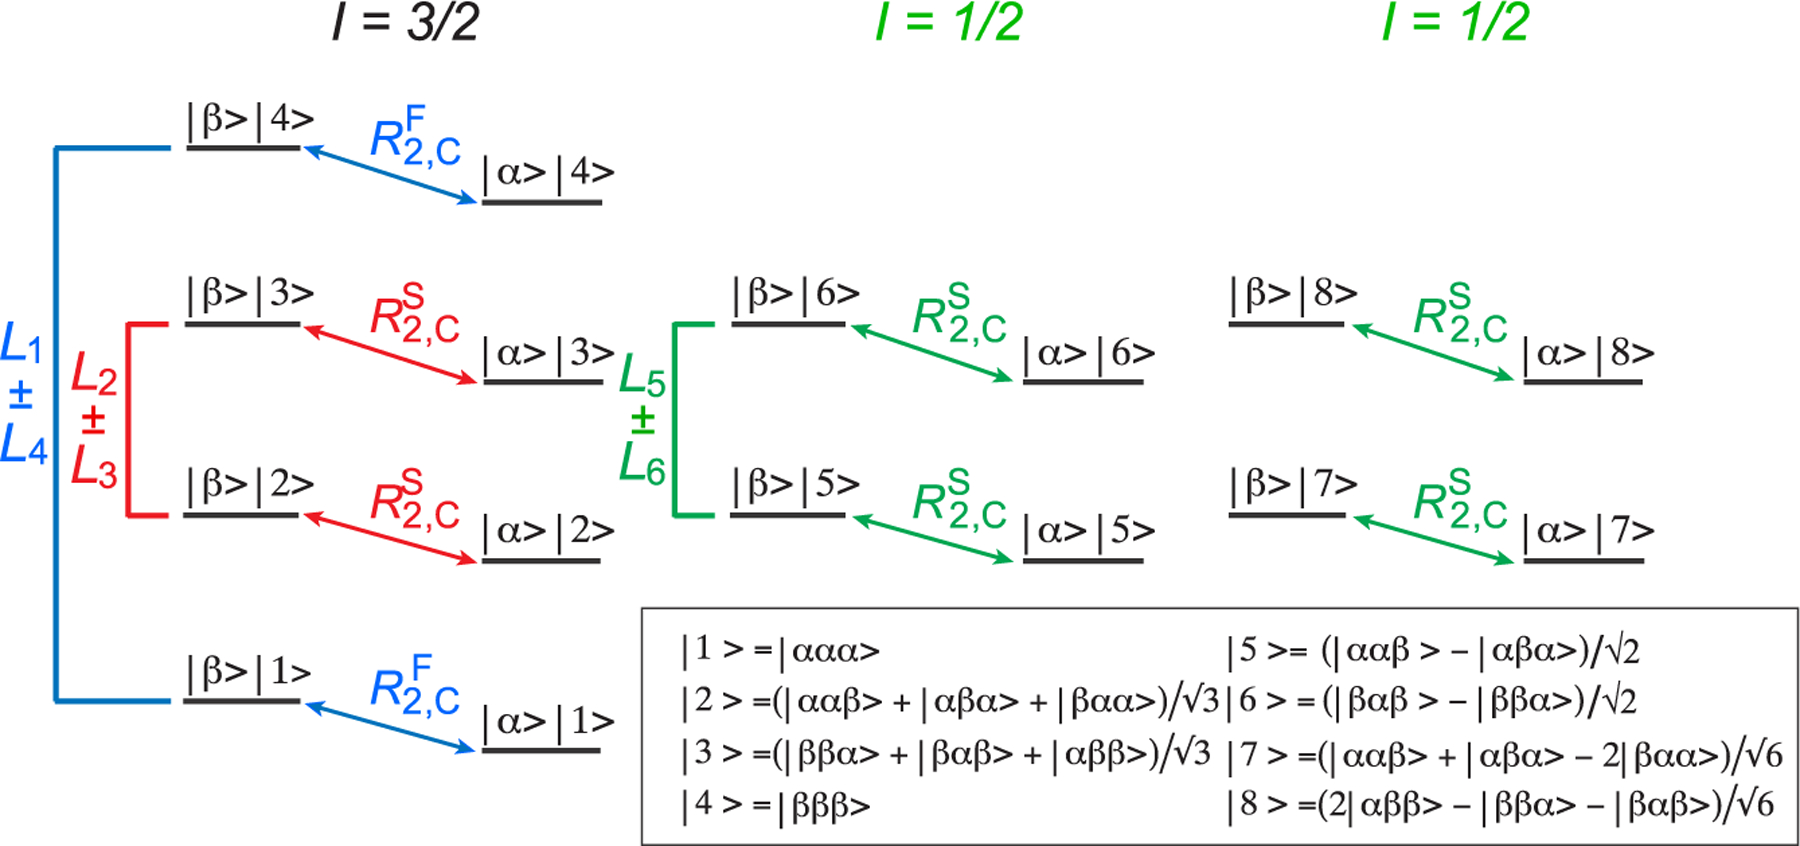
Figure 1.

Energy level diagram of the 13CH3 (AX3) spin-system of a methyl group. Single-quantum 13C transitions are shown by diagonal arrows. The slow- and fast-relaxing 13C (R2,C) transitions are distinguished by the superscripts “S” and “F”, respectively. The spin quantum numbers, I, of the three manifolds are specified below the energy-level diagram. The slow- and fast-relaxing 13C transitions of the I = 3/2 manifold are colored in red and blue, respectively, while the transitions of the I = 1/2 manifold are colored in green. Various 13C magnetization modes isolated in the NMR experiments are denoted by Li ± Lj (i,j ∈ {1–6}) and shown using the same coloring scheme. All 16 eigenstates are denoted by |m⟩|n ⟩ , where |m⟩ is the state of the 13C spin, m ∈ {α, β}, and the eight 1H eigenstates |n⟩ are described by linear combinations of |i, j, k⟩ (i, j, k ∈ {α, β}) as shown below the diagram.
