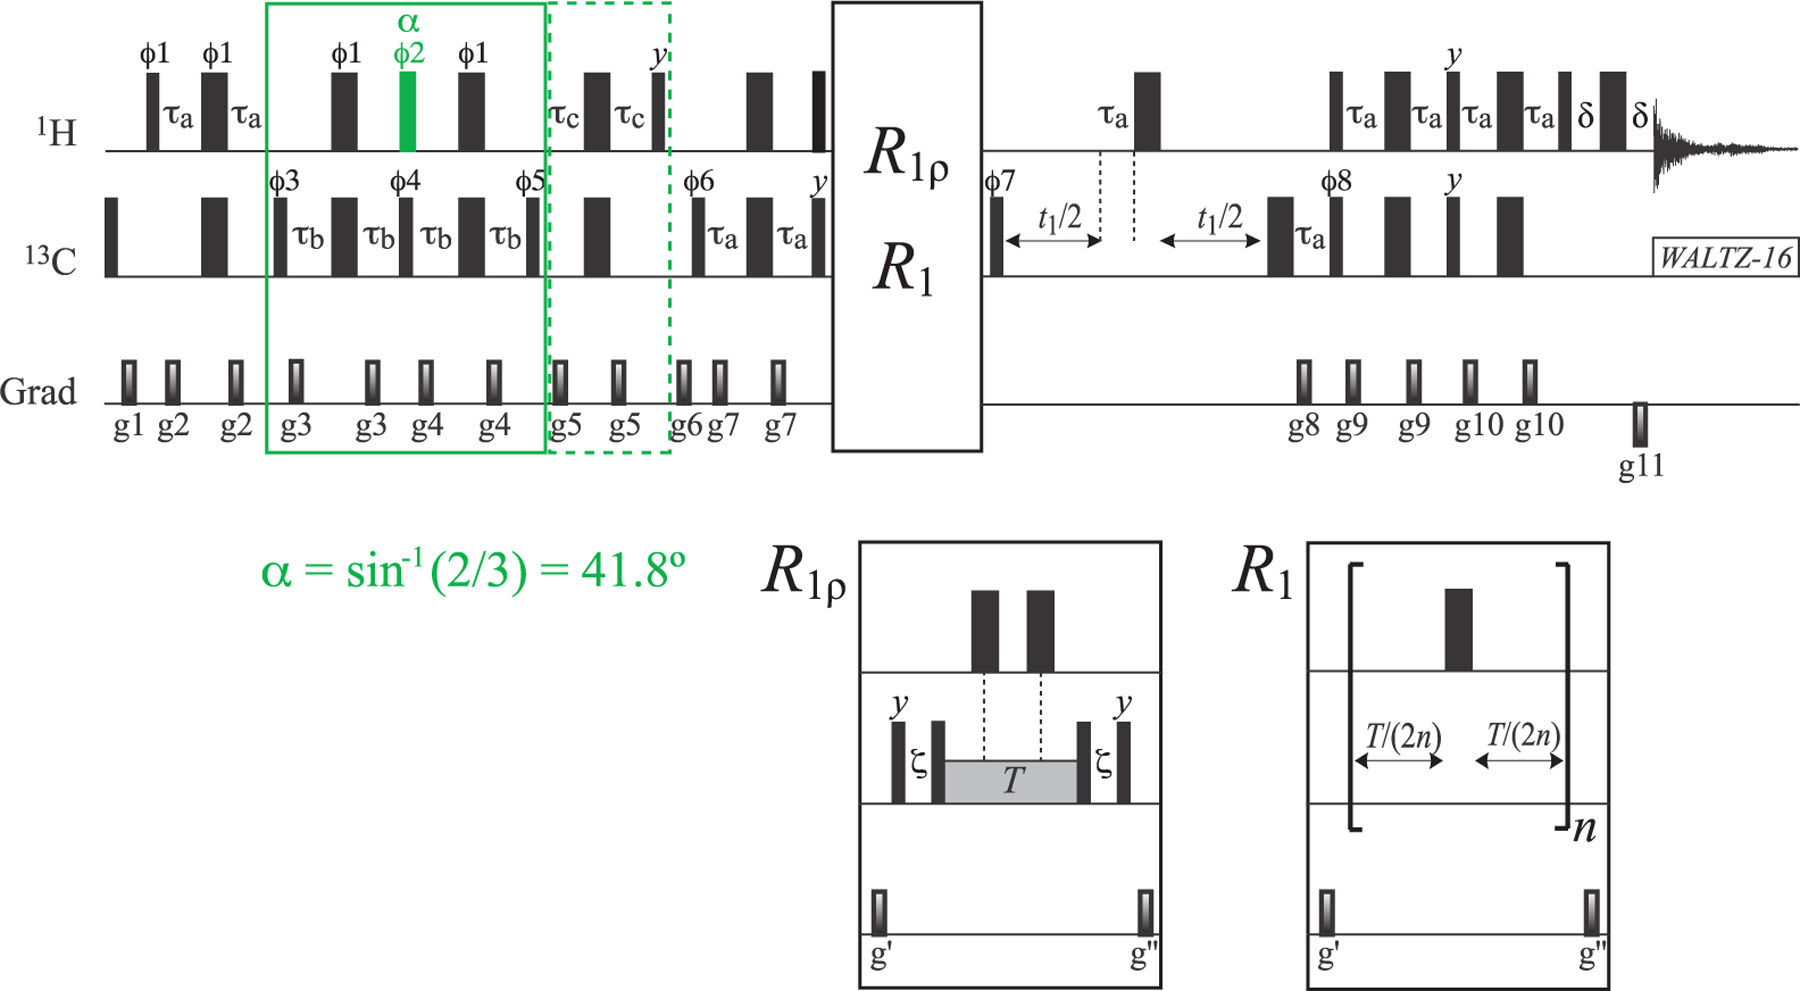
Figure 2.

Pulse scheme for the measurement of R1ρ and R1 relaxation rates of the 13C magnetization mode (L5 + L6) (I = 1/2 manifold) in 13CH3 methyl groups. All narrow and wide rectangular pulses are applied with flip angles of 90° and 180°, respectively, along the x-axis unless indicated otherwise. For ILV-{13CH3}-labeled samples, the 1H and 13C carrier frequencies are positioned at 0.5 and 20 ppm, respectively, in the center of the Ileδ1-Leu-Val methyl region; for Iδ1-{13CH3}-labeled samples, the 1H and 13C carrier frequencies are set to 0.7 and 12 ppm, respectively. All 1H and 13C pulses are applied with the highest possible power, while 13C WALTZ-16 decoupling23 is achieved using a 2 kHz field. The 1H pulse colored in green is applied with flip angle α equal to sin−1(2/3) = 41.8°. Delays are τa = 1/(4JHC) = 2.0 ms; τb = 1/(8JHC) = 1.0 ms; τc = 1/(12JHC) = 0.67 ms; δ = 300 μs; and ζ = 1/(2π × BSL) – (4/π) × pwc,24,25 where BSL is the strength of 13C spin-lock field (Hz) applied along the x-axis, “pwc” is the length of the 13C 90° (high power) pulse. T is a variable relaxation delay. The durations and strengths of the pulsed-field gradients (ms; G/cm) are as follows: g1 = (1; 25), g2 = (0.4; 15), g3 = (0.3; 12), g4 = (0.35; 15), g5 = (0.2; 20), g6 = (1.2; −15), g7 = (0.4; 12), g8 = (0.2; 35), g9 = (0.5; 12), g10 = (0.4; 12), g11= (0.053; −35), g′= (1.2; 12), and g″= (0.8; 10). The phase cycle is as follows: ϕ1 = x; ϕ2 = 2(y), 2(−y); ϕ3 = 2(x), 2(−x); ϕ4 = y, −y; ϕ5 = 4(x), 4(−x); ϕ6 = 2(x), 2(−x); ϕ7 = x, −x; ϕ8 = x; receiver phase = 2(x, −x), 2(−x, x). Quadrature detection in t1 is achieved in a Rance-Kay mode26,27 by recording a pair of data sets for each value of t1 corresponding to (ϕ8, g8) and (−ϕ8, −g8). The phase ϕ7 is incremented by 180° along with the phase of the receiver for each complex t1 point.28
