
Figure 3.
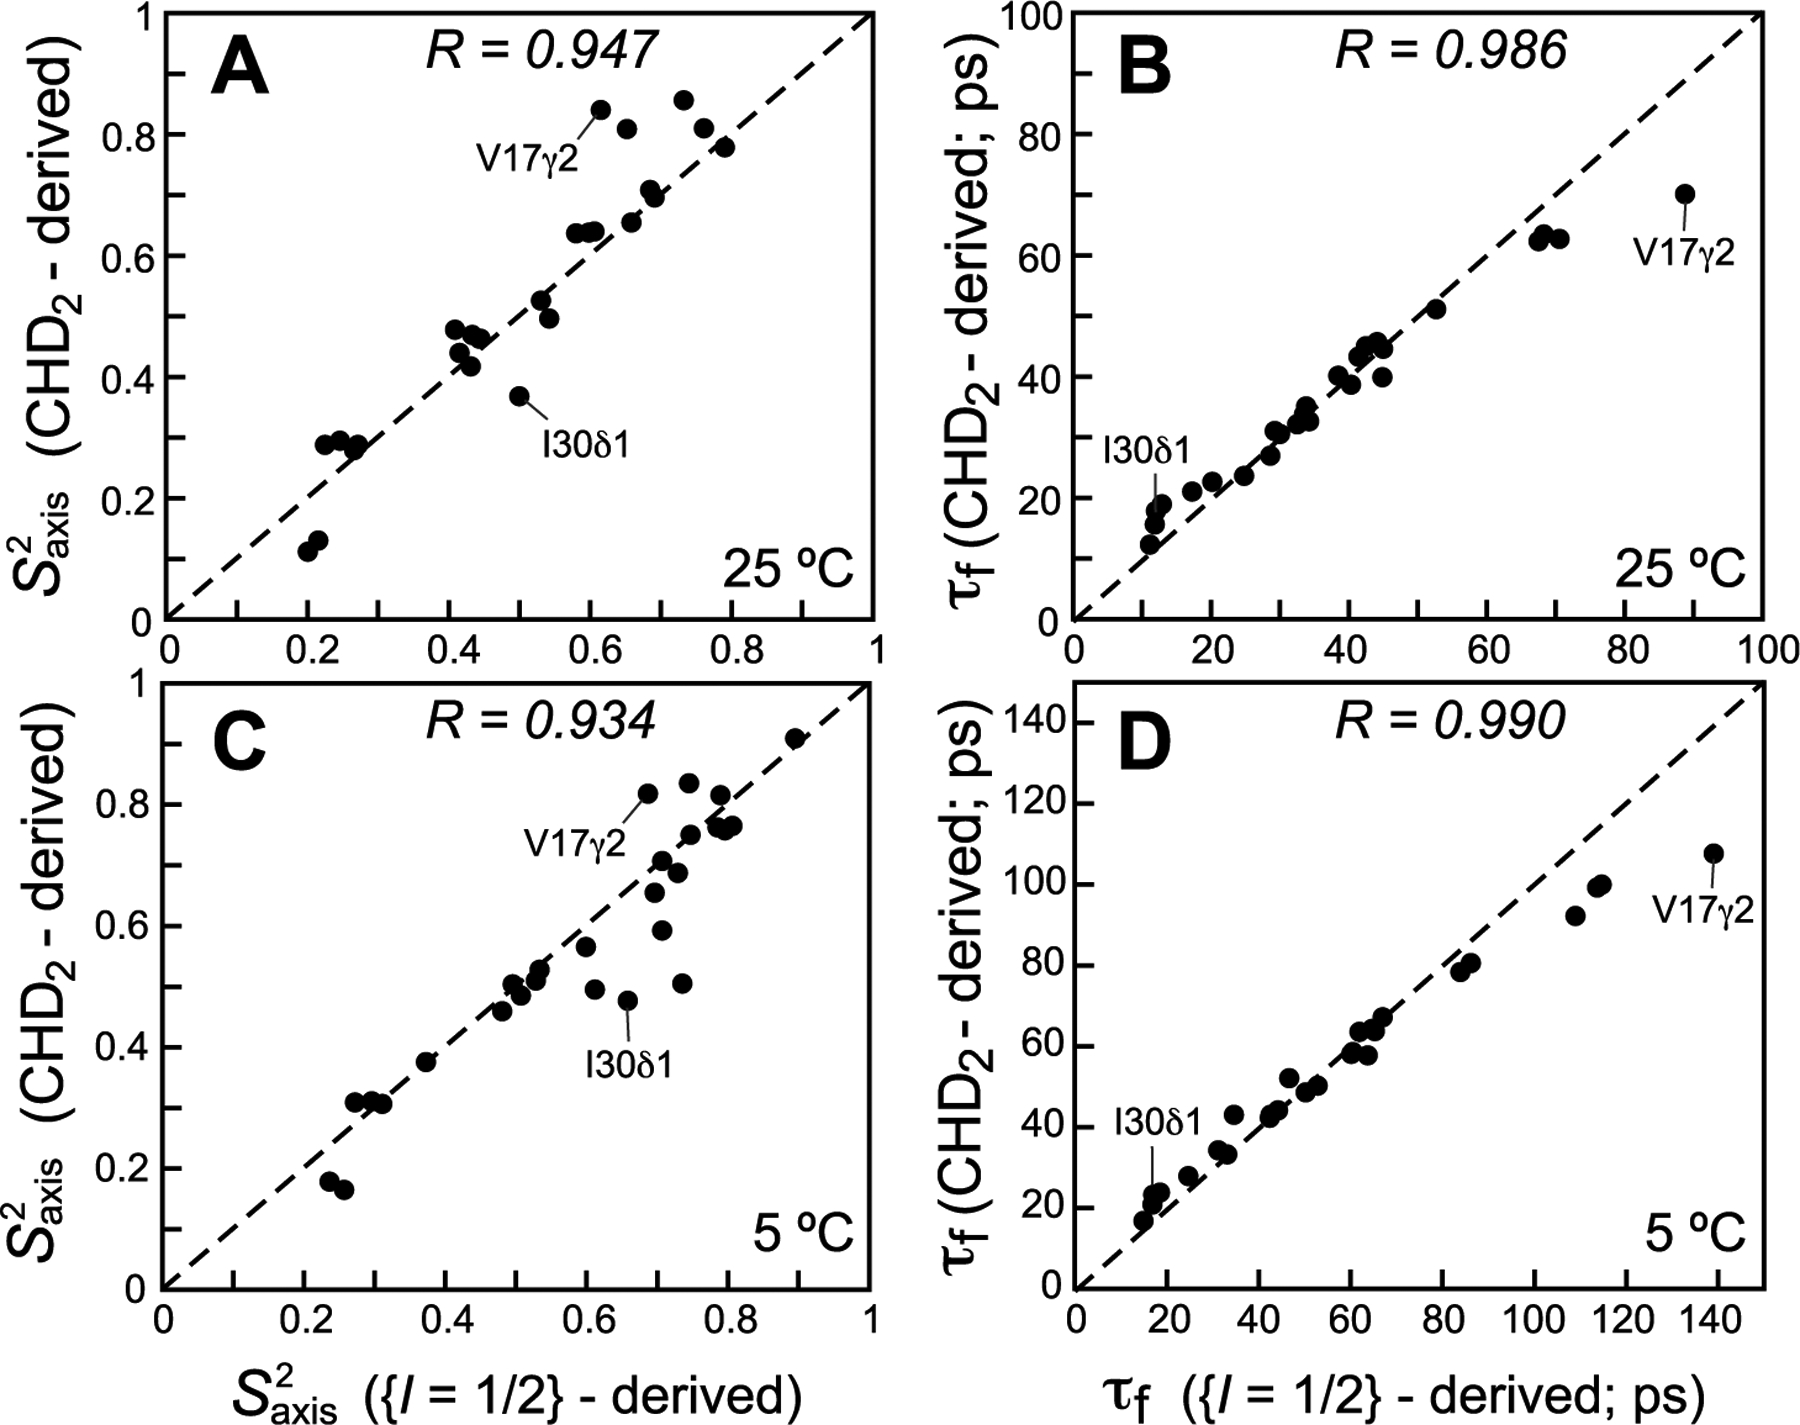
Correlation plots comparing methyl-axis dynamics parameters derived from 13C relaxation measurements of the (L5 + L6) magnetization mode (I = 1/2 manifold) in 13CH3 methyls using the scheme in Figure 2 (x-axes) with those derived from 13C relaxation in 13CHD2 methyls (y-axes) for ILV-labeled samples of ubiquitin at 25 °C (upper row; (A) and (B) τf; 29 correlations) and 5 °C (lower row; (C) and (D) τf; 30 correlations). All data were collected at 600 MHz. The data for the L50δ2 and L56δ2 methyl sites were excluded from the plots because of large exchange contributions to their R2 values. Linear correlation coefficients are shown at the top of each plot. Dashed lines are drawn at y = x.