
Figure 7.
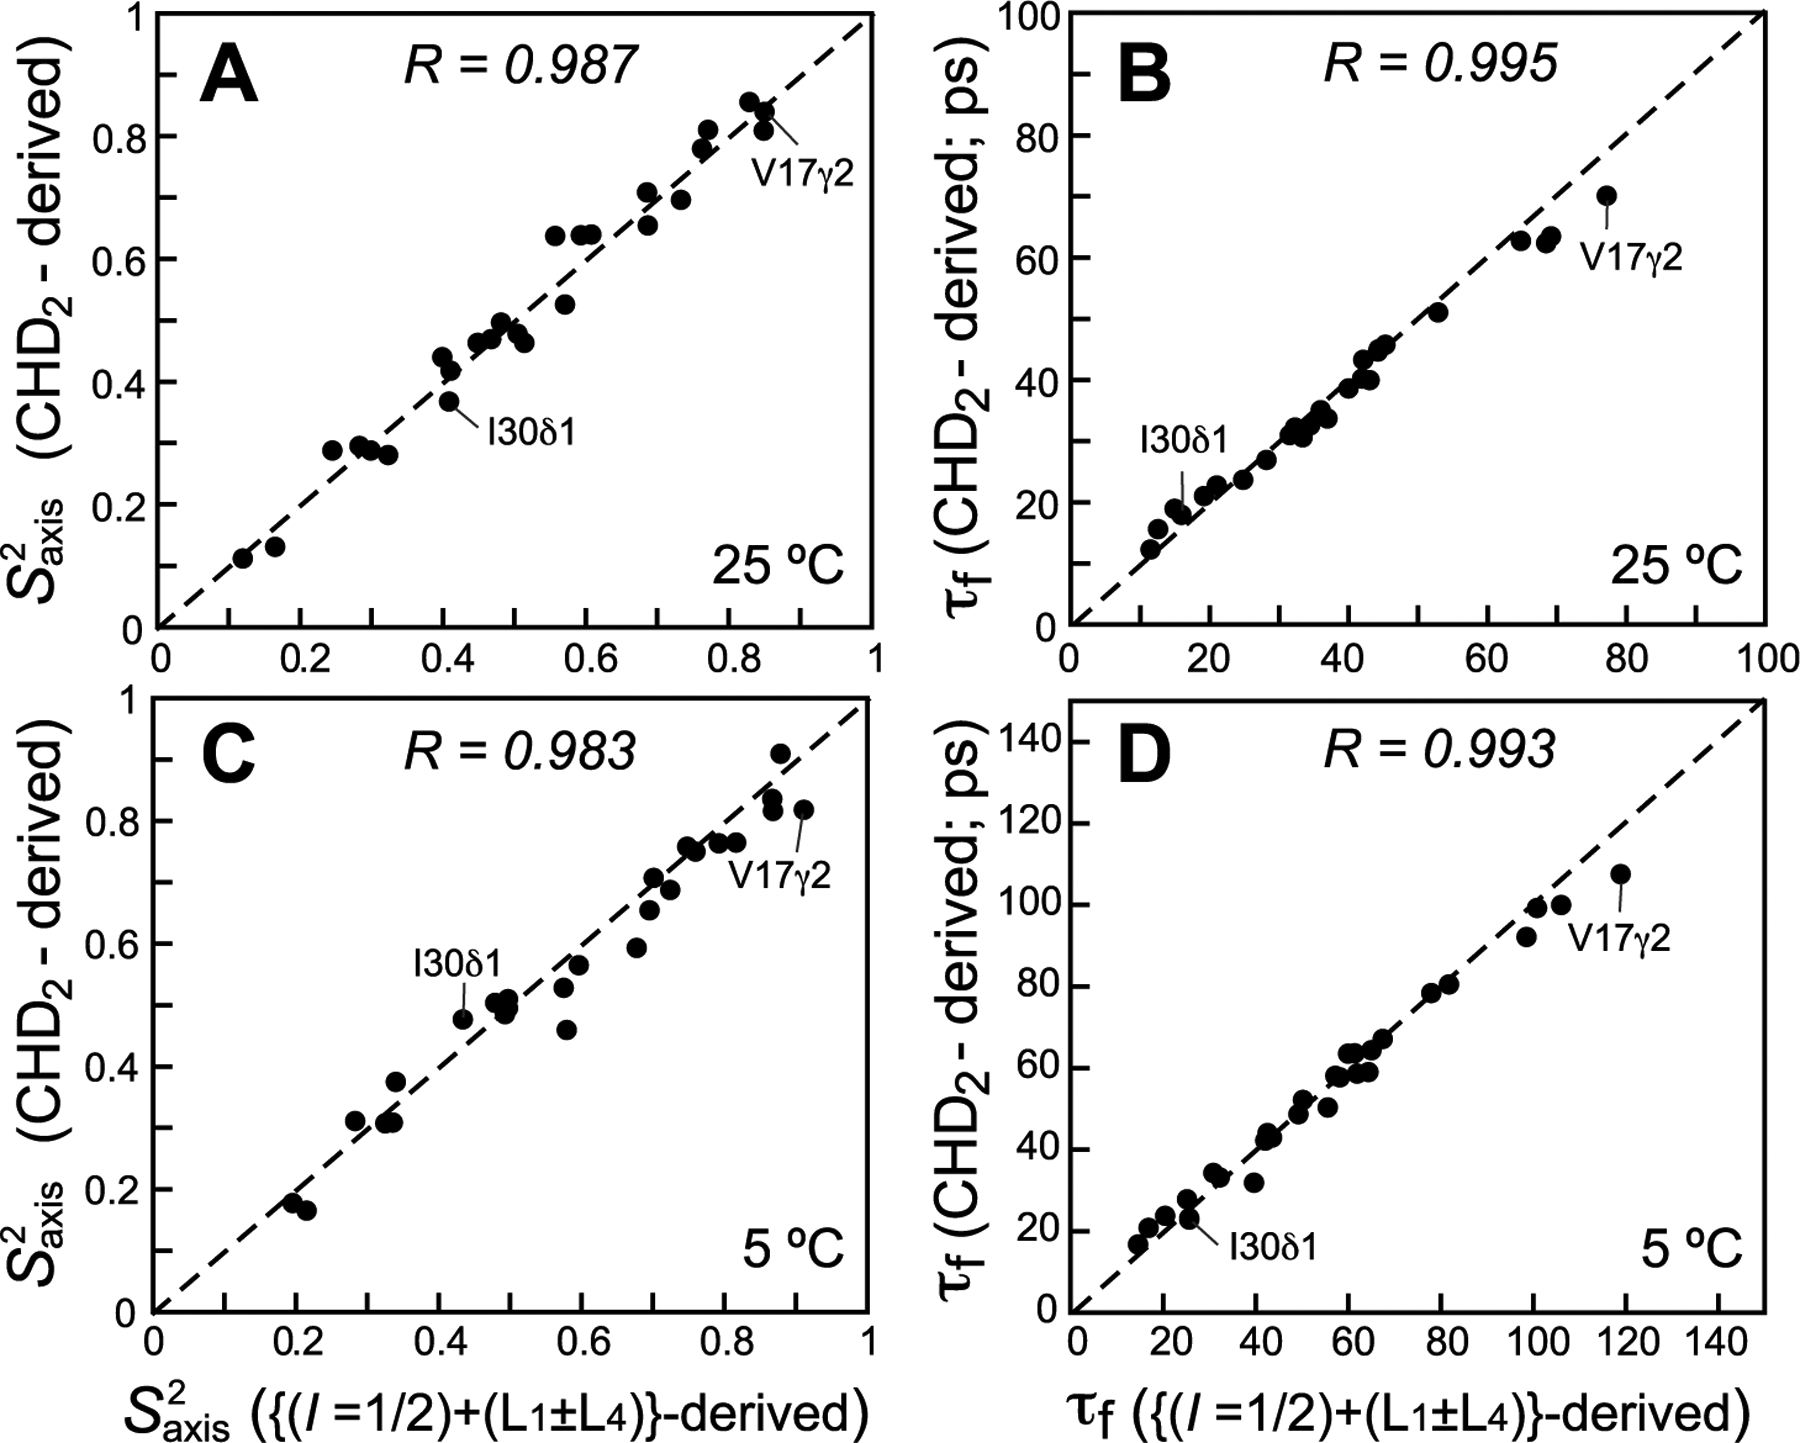
Correlation plots comparing methyl-axis dynamics parameters derived from 13C relaxation of the (L5 + L6) mode complemented with 13C relaxation of (L1 ± L4) in 13CH3 methyls (x-axes) with those derived from the 13C relaxation in 13CHD2 methyls (y-axes) for an ILV-labeled sample of ubiquitin at 25 °C (upper row; (A) and (B) τf; 29 correlations) and 5 °C (lower row; (C) and (D) τf; 30 correlations). All data were collected at 600 MHz. Linear correlation coefficients are shown at the top of each plot. Dashed lines are drawn at y = x.