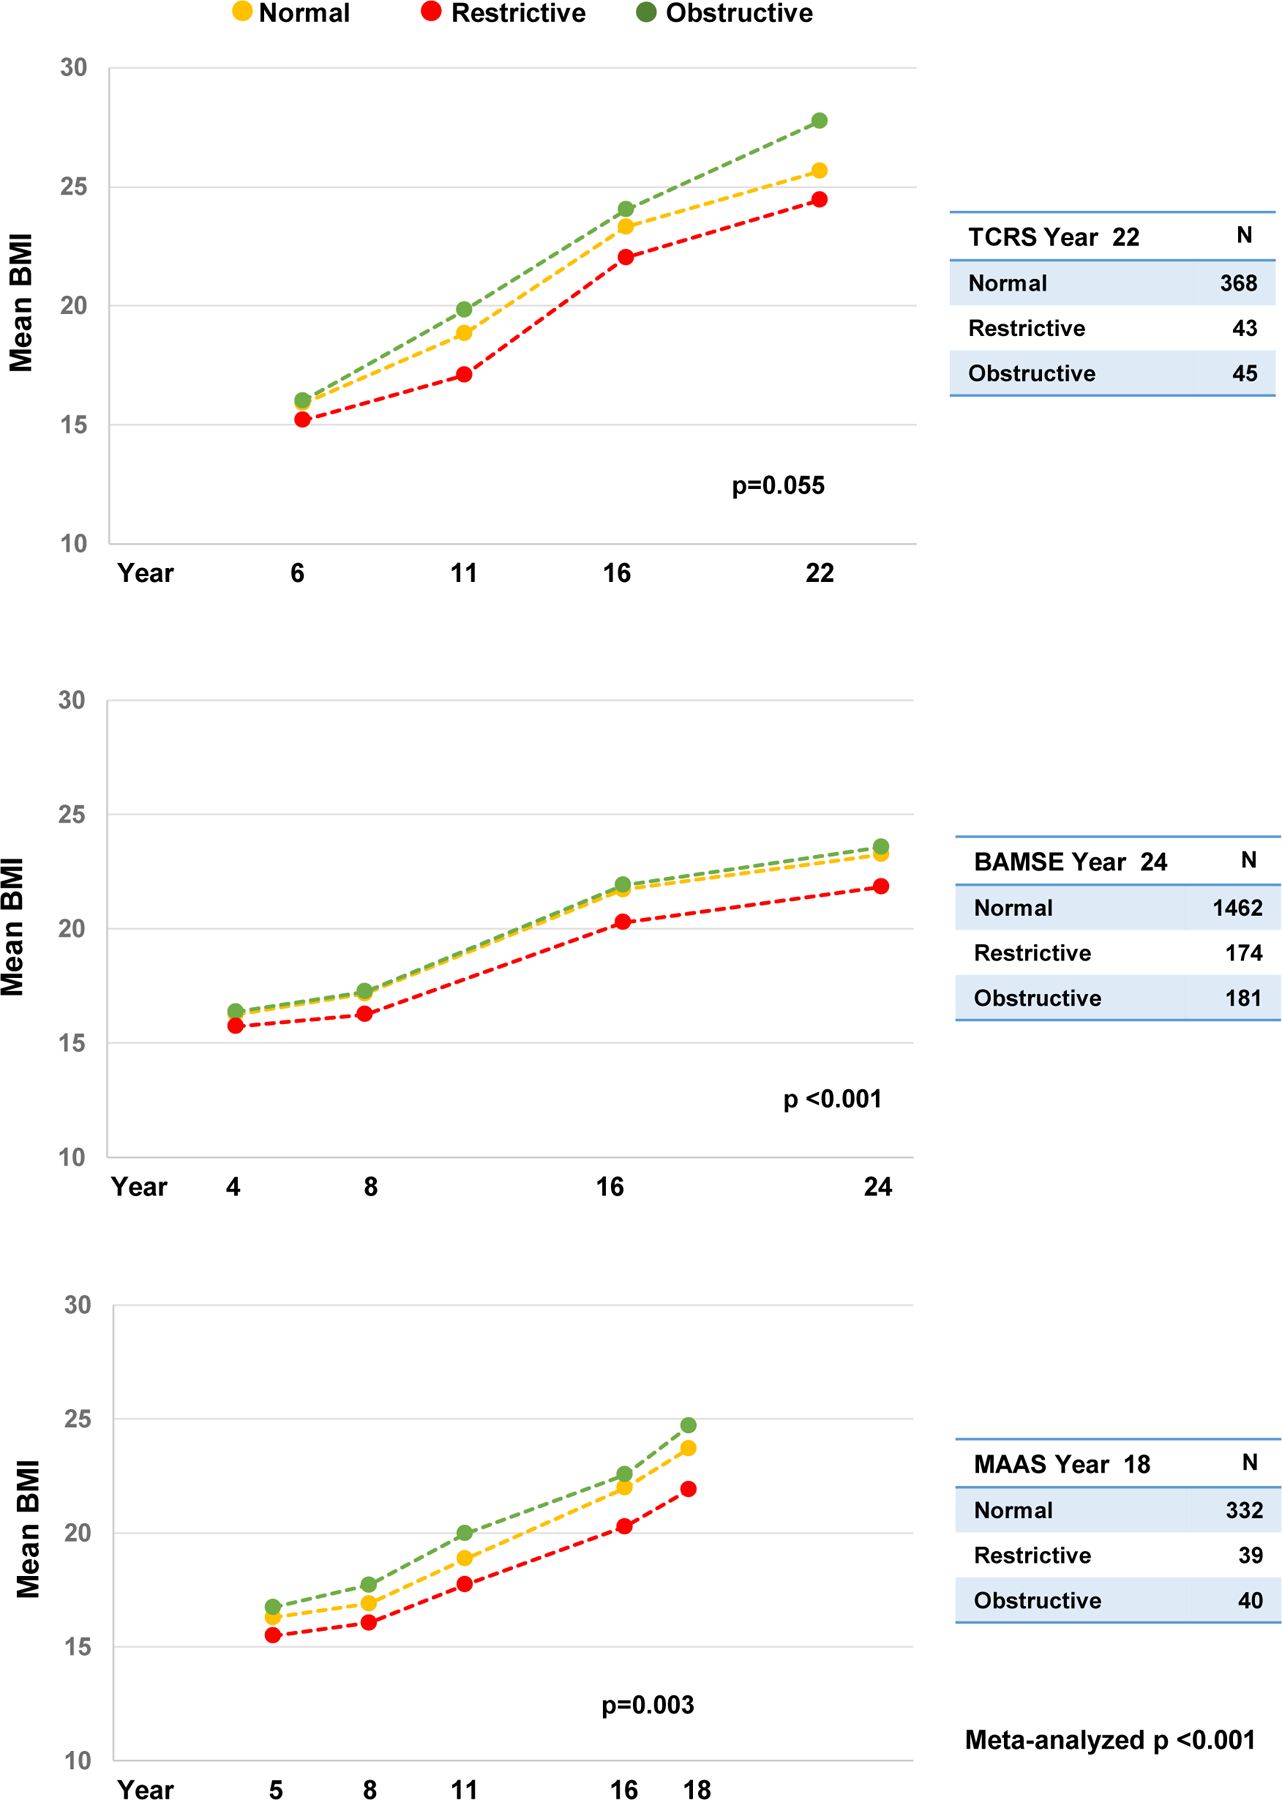
Figure 2: Mean body mass index (BMI) at each age by adult spirometric patterns.

In TCRS, spirometry data from year 22 were used to closely parallel those of BAMSE (year 24) and MAAS (year 18). P values were obtained from random effect models assessing the relation between spirometric patterns (year 22 in TCRS, year 24 in BAMSE, year 18 in MAAS) and BMI across ages (years 6–22 in TCRS, years 4–24 in BAMSE, years 5–18 in MAAS), with adjustment for survey year, sex, and race/ethnicity. P-values shown for each cohort are for the comparison of the restrictive pattern versus normal pattern.
