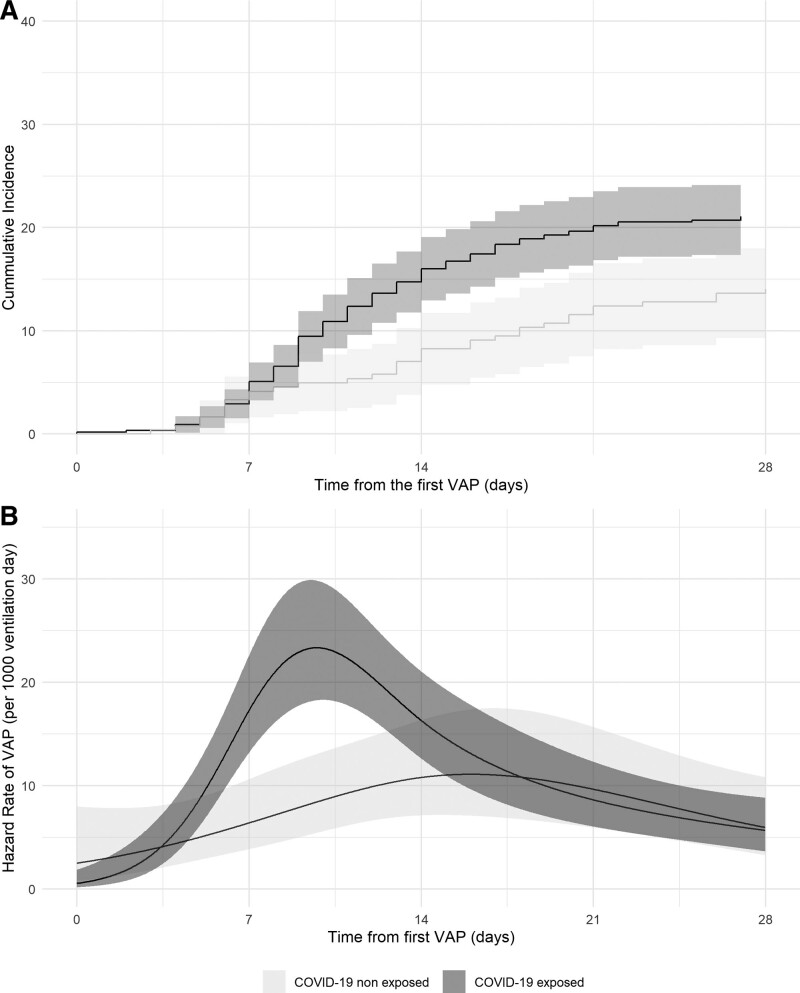
Figure 3.
Cumulative incidence and time-dependent hazard rate of the second ventilator-associated pneumonia (VAP) episode. A, Cumulative incidence curve for the second VAP episode among coronavirus disease 2019 (COVID-19) exposed and nonexposed patients and their 95% CIs. B, Time-dependent hazard rate for the second VAP episode for COVID-19 exposed and nonexposed patients and their 95% CIs. T0 = time from the first VAP episode.

