Figure 4.
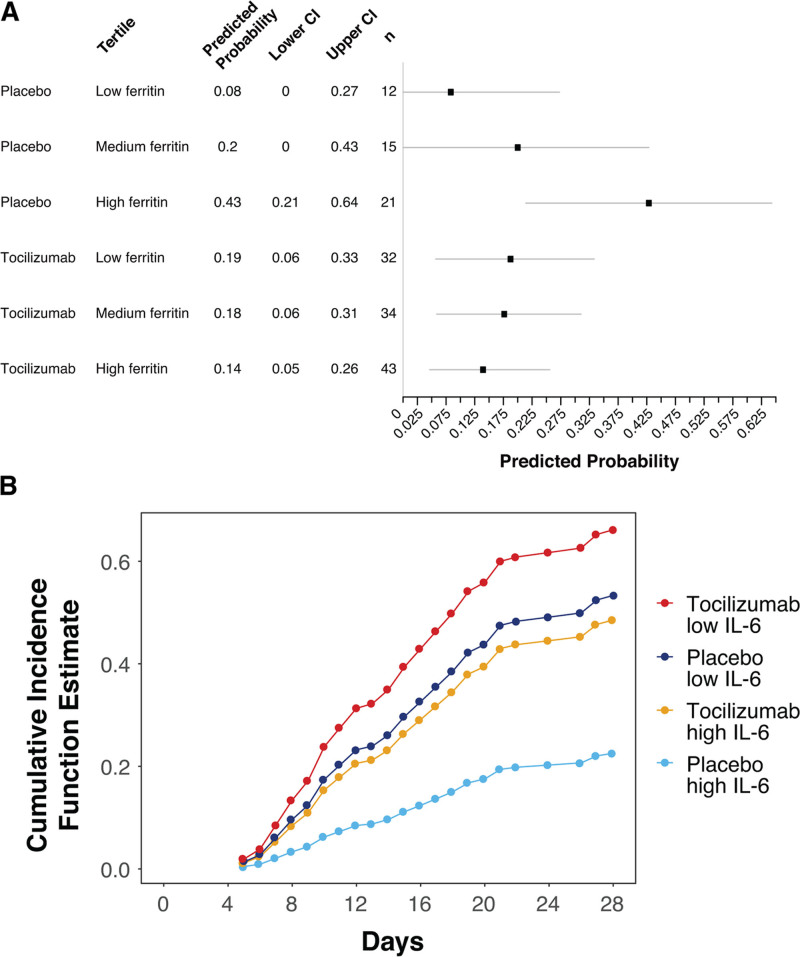
Predictive biomarker assessment for the subset of patients in ordinal scale categories 4 and 5 at baseline in COVACTA (n = 157). A, Death by day 28 according to baseline ferritin levels. Ferritin values were log-transformed. Shown are predicted probabilities for death within each tertile of ferritin (tertile cutoff values were 3.63 pmol/L [minimum], 1,480.77 pmol/L, 3,150.29 pmol/L, and 75,299.67 pmol/L [maximum]) showing predicted probability and 95% CI based on an unadjusted model (calculated based on all-comers) fit using samples restricted to those for patients in ordinal scale categories 4 and 5 at baseline. B, Time to hospital discharge by baseline interleukin (IL)–6 levels. Figure shows the cumulative incidence function for time to hospital discharge based on the median IL-6 cutoff value.

