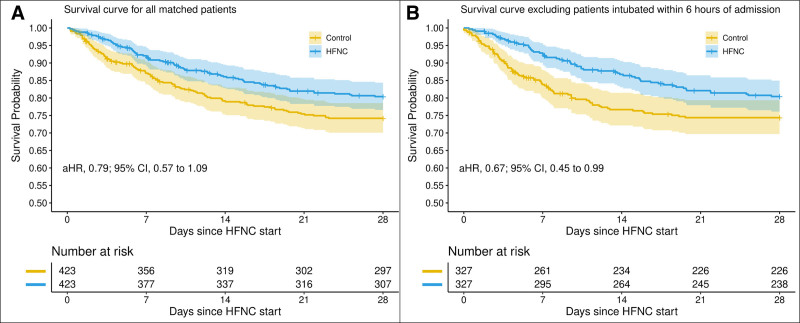
Figure 2.
Primary analyses of mortality according to high-flow nasal cannula (HFNC) exposure. These Kaplan-Meier curves depict cumulative survival in (A) patients with any HFNC exposure and their matched controls as well as in (B) HFNC patient not intubated within 6 hr of admission and their matched controls. p value of less than 0.05 for comparison between HFNC patients not intubated within 6 hr of admission and their matched controls. aHR = adjusted hazard ratio.

