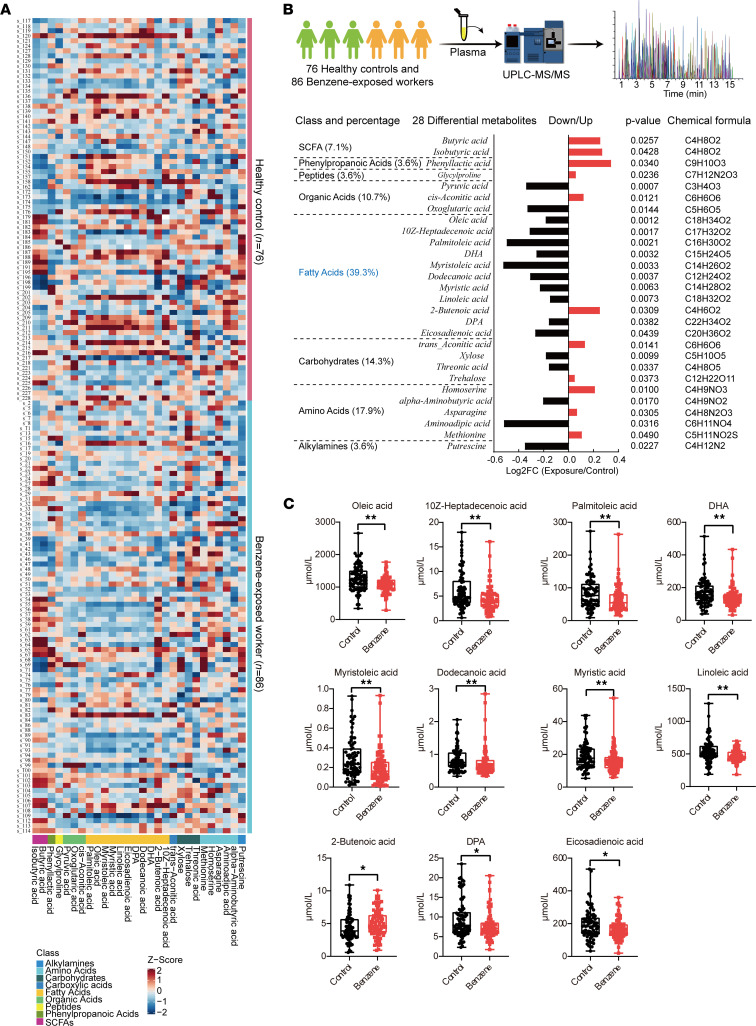
Figure 2. Plasma metabolic profiles in benzene-exposed workers (n = 86) and healthy controls (n = 76).
(A) Visualization of 28 plasma differential metabolite expression values in 2 groups by heatmap. (B) Classification and expression changes of differential metabolites. (C) Median concentrations of the 11 screened plasma fatty acid levels. Each plasma sample was measured 3 times based on UPLC-MS/MS. Mann-Whitney U/Wilcoxon rank-sum test was performed to compare the differences in metabolite levels between the 2 groups. *P < 0.05; **P < 0.01.

