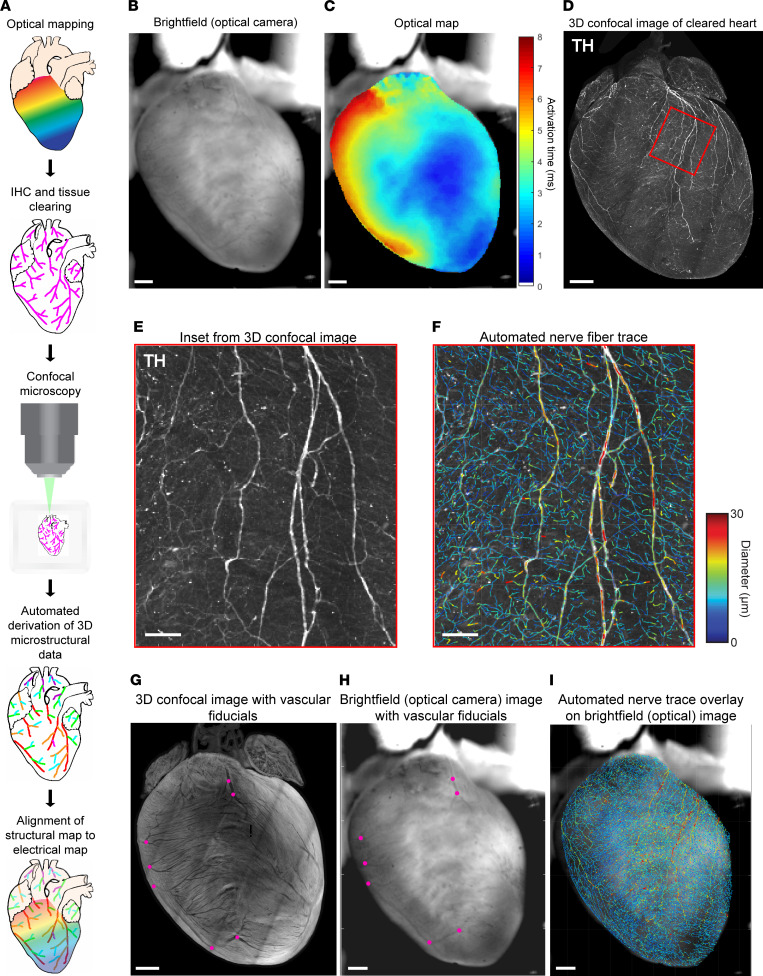
Figure 1. Optical mapping and tissue clearing pipeline to align electrical and structural maps.
(A) Schematic of optical mapping, clearing, imaging, and automated feature tracing steps in the alignment pipeline. (B and C) Bright-field image taken simultaneously with optical action potential map showing activation in sinus rhythm. (D) Maximum intensity projection (MIP) image of tyrosine hydroxylase–positive (TH-positive) nerve fibers on the ventral surface of the same heart after IHC, tissue clearing, and confocal imaging. (E and F) High-magnification images of the boxed region in D, with TH staining alongside nerve-fiber tracing by computer vision, color-coded by fiber diameter. (G and H) Venous bifurcations (magenta points) on MIP confocal shell image of a cleared heart alongside bright-field image of same heart were used as fiducial anchors for alignment. (I) Automated global nerve-fiber tracing aligned with bright-field image allows spatial correlation with optical action potential data. Scale bars: 1 mm (B–D and G–I); 100 μm (E and F).

