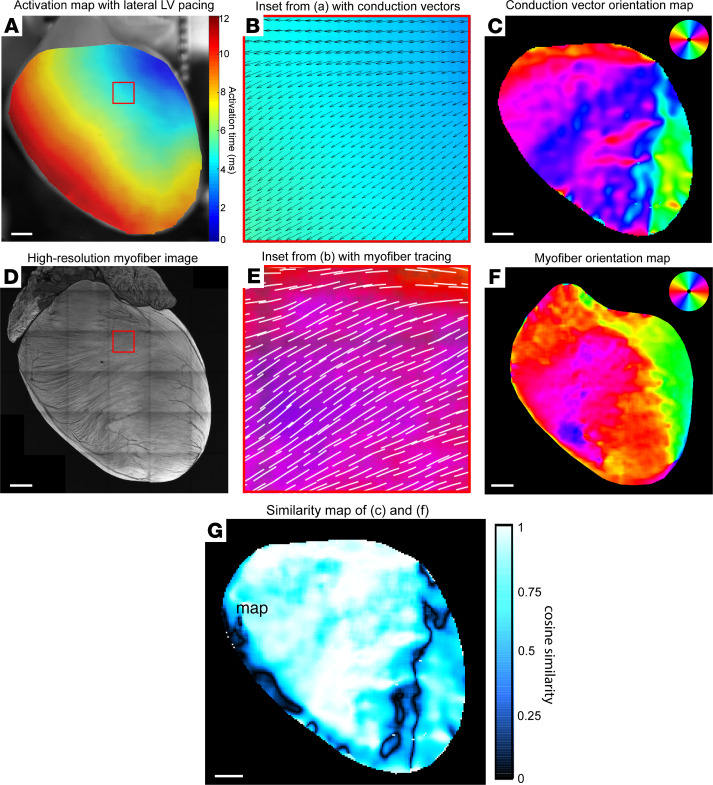
Figure 2. Structure-function alignment correlates global ventricular impulse propagation with myofiber orientation.
(A) Optical activation map of representative sham heart with basolateral left ventricular (LV) pacing. (B) High-magnification image of the boxed region in A showing an activation map with overlay of conduction velocity vectors calculated in ElectroMap. (C) Global ventricular conduction vector orientation map color-coded by vector angle. (D) Maximum intensity projection confocal image of muscle autofluorescence with high-resolution myofiber structure. (E) High-magnification image of the boxed region in D, with overlay of automated myofiber orientation tracing. (F) Global ventricular myofiber orientation map color-coded by fiber angle. (G) Cosine similarity map calculated by taking cosine of angular difference between C and F. Scale bars: 1 mm (A, C, D, F, and G).

