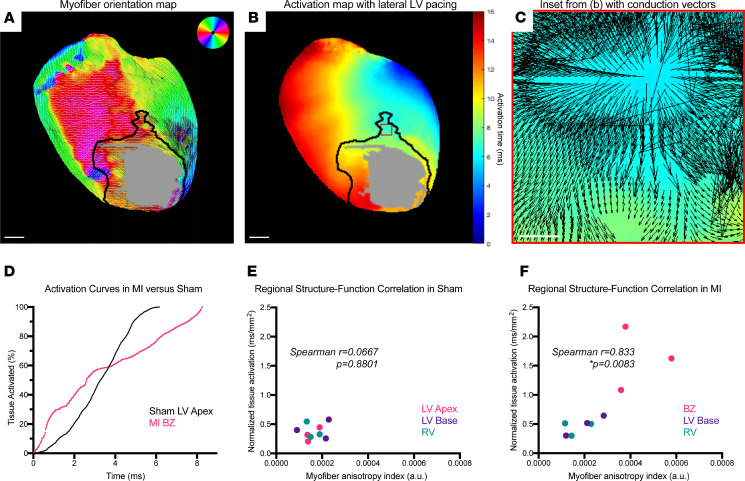
Figure 3. A composite metric of myofiber anisotropy and tissue activation defines infarct border zones.
(A) Color-coded myofiber orientation map from chronic myocardial infarction (MI) heart with black line delineating border zone (BZ) and gray patch delineating dense scar. Dark patch on left ventricular (LV) lateral wall denotes location of coronary ligature, which was excluded from quantitative analyses. Atria were cropped from image for ease of interpretation. (B) Activation map from same chronic MI heart with dense scar region defined by gray patch and BZ delineated by black line. (C) High-magnification image of the boxed region in B, with activation map with overlay of conduction velocity vectors showing discontinuous propagation. (D) Representative tissue activation curves from anatomically defined LV apex region of sham heart (black) versus infarct BZ region (magenta), showing isotropic conduction versus anisotropic and conduction block. (E and F) Plots of regional myofiber anisotropy indices versus normalized tissue activation times, showing no correlation in sham (Spearman’s r = 0.0667, P = 0.8801, n = 9 regions from 3 mice) versus positive correlation in MI (Spearman’s r = 0.833, P = 0.0083, n = 9 regions from 3 mice). Scale bars: 1 mm (A and B); 100 μm (C).

