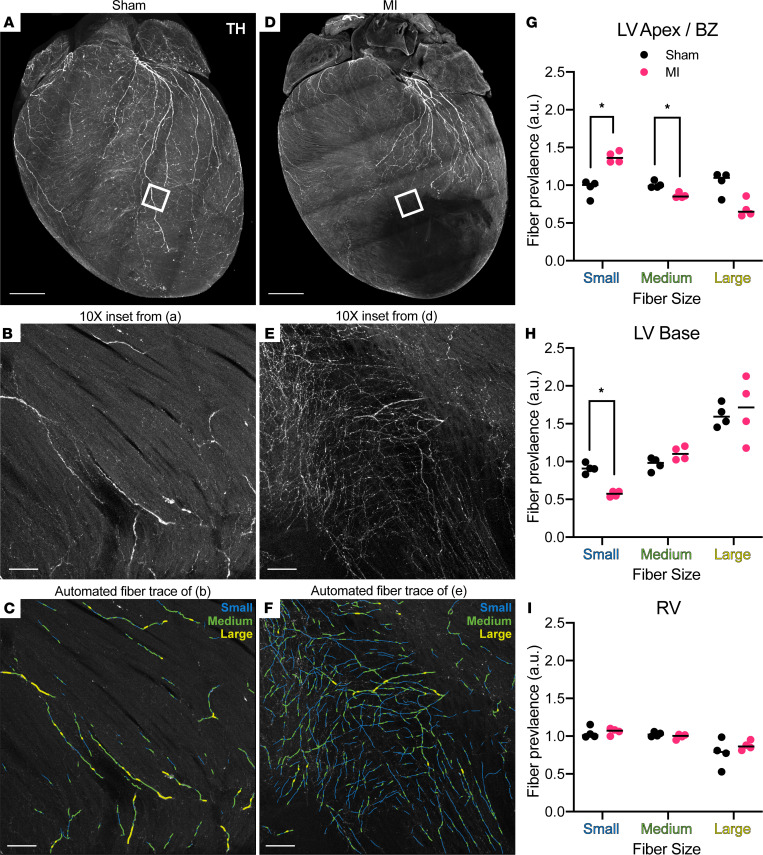
Figure 4. Altered distribution of neuroeffector endings after myocardial infarction.
(A) Maximum intensity projection (MIP) confocal image of global tyrosine hydroxylase (TH) staining of sham heart (same heart MIP was originally shown in Figure 1D for methodological demonstration purposes). (B and C) Representative images from boxed region in A (original magnification, ×10) from sham left ventricle (LV) showing TH staining and automated fiber tracing, binned by small (1.2–3 μm), medium (3–5 μm), and large (5–100 μm) diameters. (D) MIP confocal image of global TH staining in myocardial infarction (MI) heart. (E and F) Representative images from boxed region in D (original magnification, ×10) from border zone (BZ) showing TH staining and automated fiber tracing, binned by small (1.2–3 μm), medium (3–5 μm), and large (5–100 μm) diameters. (G–I) Regional comparisons of fiber size prevalence between sham (black) and MI (magenta), with black lines denoting medians and asterisks denoting statistical significance (Mann-Whitney, *P = 0.0286, n = 4 mice per group). Scale bars: 1 mm (A and D); 100 μm (B, C, E, and F). RV, right ventricle.

