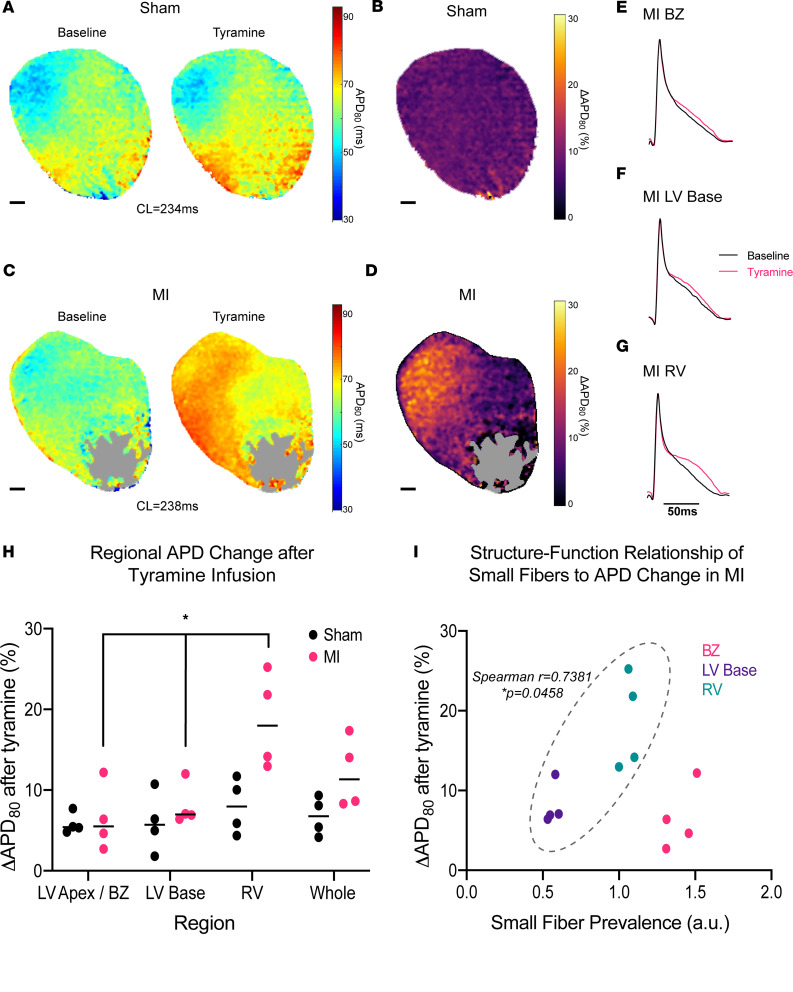
Figure 5. Altered neuroeffector distribution underlies perturbed myocardial sympathetic control after chronic infarction.
(A) Eighty percent of action potential duration (APD80) maps of representative sham heart at baseline and after infusion of 5 μM tyramine. (B) Change in APD80 (ΔAPD80) map of sham heart. (C) APD80 maps of representative MI heart at baseline and after infusion of 5 μM tyramine. Gray region denotes dense scar. (D) APD80 map of MI heart. (E–G) Representative action potentials at baseline (black) and after tyramine (magenta) in anatomically segmented regions of MI heart. (H) Comparison of regional, tyramine-mediated changes in APD80 between sham and MI hearts, with MI hearts showing significant regional variation in tyramine effect (Kruskal-Wallis, *P = 0.0132, n = 4 mice per group) while sham hearts showed no significant regional variation (Kruskal Wallis, P = 0.7463, n = 4 mice per group). (I) Plot of regional small-fiber prevalence in MI hearts versus tyramine-mediated APD change, with positive correlation in left ventricular (LV) base and right ventricular (RV) regions (Spearman’s r = 0.7381, P = 0.0458, n = 8 regions from 4 mice) but no correlation when border zone (BZ) is included (Spearman’s r = 0.021, P = 0.956, n = 12 regions from 4 mice). Scale bars: 1 mm (A–D).

