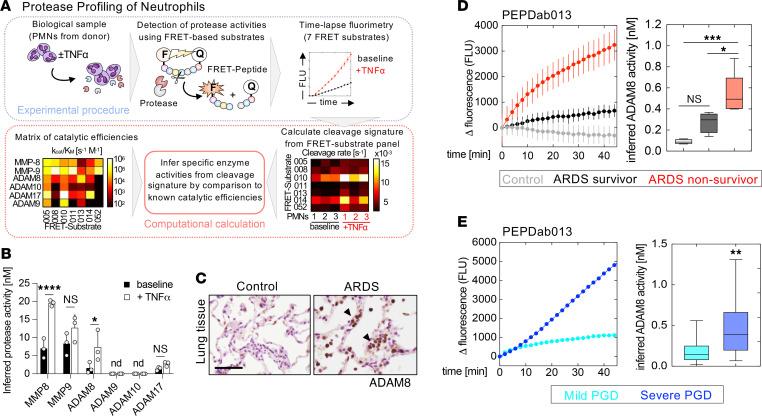
Figure 4. ADAM8 protease is expressed in human leukocytes and detected in lung fluids of patients with ARDS.
(A) Workflow for protease profiling of PMNs at baseline and during activation with TNF-α (20 ng/mL) using 7 FRET-based peptide substrates (PEPDab 005, 008, 010, 011, 013, 014, and 052). To deduce a profile of specific MMP and ADAM activities, peptide cleavage patterns from 3 independent donors were calculated using a nonlinear kinetic model; proteolytic signatures were compared to a reference matrix of catalytic efficiencies to deconvolute protease identities. (B) Proteolytic profiling infers increased activity of known neutrophil MMPs and significant levels of active ADAM8; *, P < 0.05; ****, P < 0.0001; 2-way ANOVA followed by Holm-Šídák multiple-comparison test. (C) Representative images of ADAM8-positive leukocytes (arrowheads, brown color) in lung tissue of patients with ARDS and healthy controls. Scale bar, 50 μm. (See enlarged sections in Supplemental Figure 12.) (D) Representative time-lapse fluorimetry of healthy control BAL (gray) and BAL from patients with ARDS from pneumonia (black; ARDS survivor, red; ARDS nonsurvivor) using the most ADAM8-specific FRET reporter, PEPDab013 (mean ± SD of 3 technical replicates); right, box-and-whisker plots of inferred ADAM8 activity in BAL samples of control patients (gray, n = 4), ARDS survivors (black, n = 5), and ARDS nonsurvivors (red, n = 6). *, P < 0.05; ***, P < 0.001; 1-way ANOVA followed by Tukey’s multiple-comparison test. (E) Representative time-lapse fluorimetry of BAL of patients with mild (cyan) or severe PGD (blue) using PEPDab 013 (mean ± SD of 3 technical replicates); right, box-and-whisker plots of inferred ADAM8 activity in BAL samples of mild PGD (cyan, n = 16) and severe PGD (blue, n = 16). **, P < 0.005, Student’s t test with Welch’s correction. nd, not detectable.

