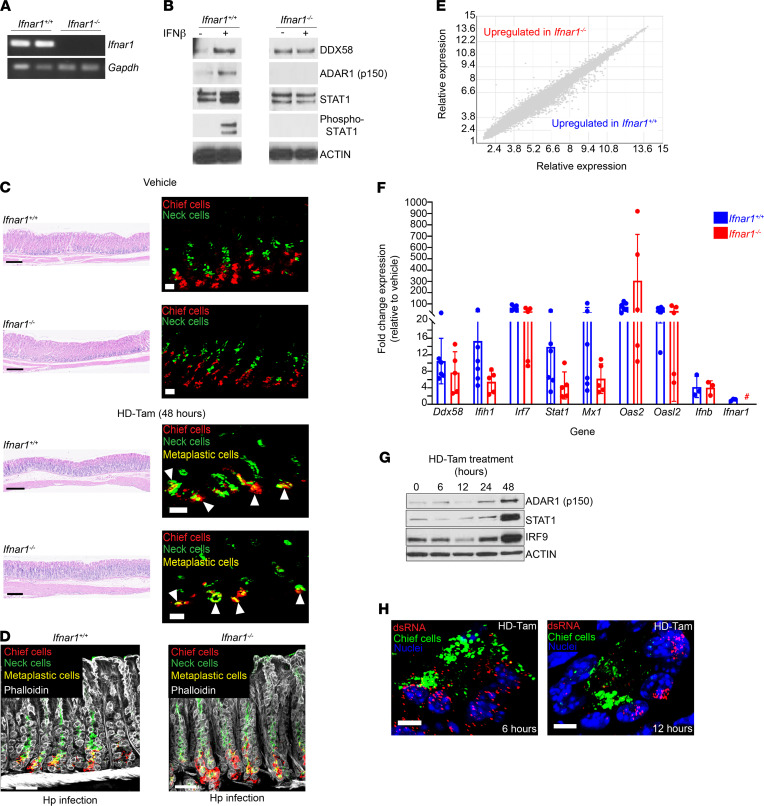
Figure 3. The dsRNA response during gastric metaplasia is independent of IFNAR1 signaling.
(A) RT-PCR of Ifnar1 amplicons from gastric corpus tissue for wild-type (Ifnar1+/+) and age-matched Ifnar1–/– mice. Each lane represents an individual mouse. Gapdh, loading control. (B) Gastroids from wild-type or Ifnar1–/– mice were treated with PBS or IFN-β (100 U/mL) for 24 hours and lysates probed with the indicated antibodies. (C) Representative gastric corpus sections of wild-type or Ifnar1–/– mice treated with vehicle or high-dose tamoxifen (HD-Tam). Right panels highlight representative glands under each treatment. Arrowheads highlight metaplastic glands. Scale bars, 250 μm (left panels), 20 μm (right panels). (D) Metaplastic changes in wild-type and Ifnar1–/– mice infected with H. pylori (Hp) for 2 weeks. Scale bars, 20 μm. (C and D) Images are representative of 3 mice per experimental treatment. (E) Relative gene expression profiles between wild-type and Ifnar1–/– mice treated with HD-Tam for 48 hours. Three mice were used per genotype. (F) Fold change expression, relative to vehicle-treated, genotype-matched mice, of various dsRNA transcripts was determined by qRT-PCR. Each data point represents gastric corpus tissue from an individual mouse across 2 independent experiments. Means (±SEM) are shown. P values were determined using Student’s t test. No significant differences (P > 0.05) were observed between wild-type and Ifnar1–/– mice for all the transcripts investigated. #, not detected. (G) Gastric corpus tissue from Ifnar1–/– mice following HD-Tam treatment. Each lane shows a representative mouse from 3 mice per time point. (H) Representative confocal images of Ifnar1–/– gastric corpus gland bases, following the indicated HD-Tam treatment times, show the accumulation of dsRNA (red). Chief cells are highlighted in green. Images are representative of 3 separate mice per time point. Scale bars, 5 μm.

