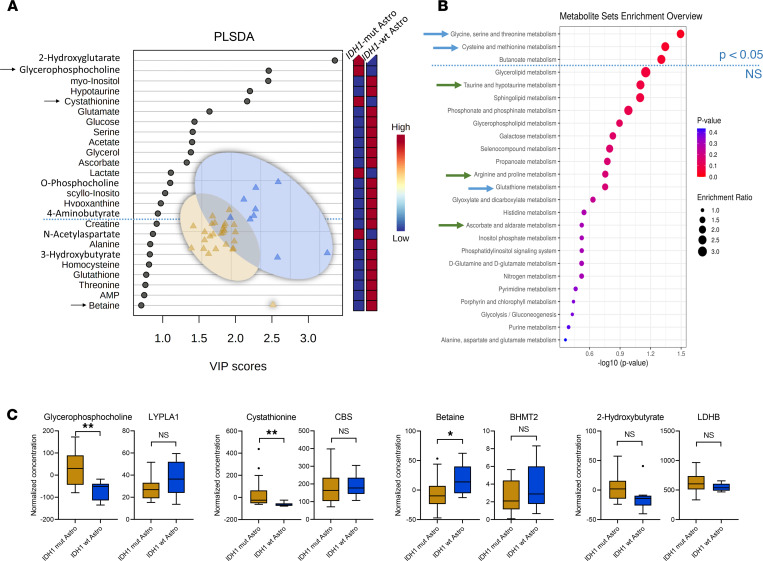
Figure 3. IDH1 mutation status cohort comparisons II.
(A–C) Multivariate partial least squares–discriminant analysis (PLS-DA) identifies 16 metabolites with variable importance in projection (VIP) scores > 1 (A) and only 3 altered pathways by quantitative enrichment analysis (B) for comparing IDH1-mut (n = 26) versus WT (n = 9) of astrocytoma (Astro) subgroup (A and B, comparison II), selection of significant metabolites (as indicated by arrow in the VIP scores plot), and their corresponding gene expression changes (C) in the IDH1 mutation status cohort comparison (II) illustrated as box-and-whisker plot with Tukey’s range test. **P < 0.01, *P < 0.05, determined by unpaired parametric 2-tailed t test with Welch’s correction. LYPLA1, lysophospholipase 1; CBS, cystathionine β-synthase; BHMT2, betaine-homocysteine S-methyltransferase 2; LDHB, lactate dehydrogenase B.

