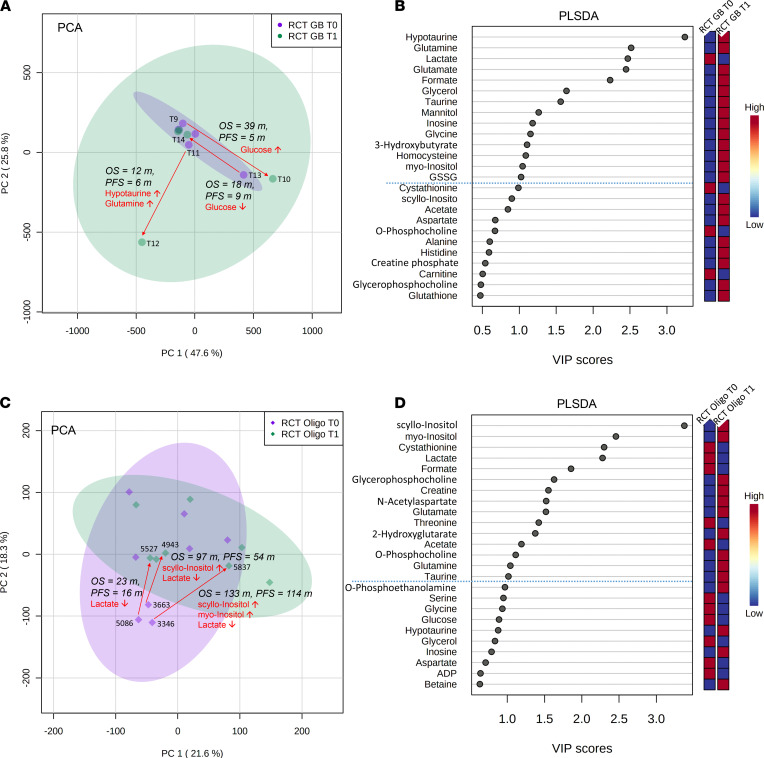
Figure 8. Longitudinal investigation cohort comparisons X and XI.
(A) Multivariate principal component analysis (PCA) of treated glioblastoma (RCT GB) (n = 5) patients (comparison X) shows 3 samples outside the main cluster. The corresponding pairs are T11/T12 with the shortest OS (12 months) and PFS (6 months) in this comparison (associated with an increase of hypotaurine and glutamine), T13/T14 (PFS 9 months, OS 18 months) with a decrease of glucose, and T09/T10 with the longest OS (39 months) and PFS (5 months) and glucose increase. (B) The partial least squares–discriminant analysis (PLS-DA) identifies 14 metabolites (on top of dashed blue line) with variable importance in projection (VIP) scores > 1 that contribute significantly to the PLS-DA model (blue box, low metabolite concentration in the respective group; red, high concentration). (C) Next, PCA of treated (n = 7) oligodendroglioma (RCT Oligo) patients (comparison XI) shows 3 samples (5086, 3663, 3346) outside the main cluster. All 3 corresponding patient pairs showed a decrease of lactate first (T0) to second tissue resection time (T1); however, additional increase of scyllo- and myo-inositol extended overall and PFS in 3663/4943 (OS 97 months, PFS 54 months) and 3346/5837 (OS 133 months, PFS 114 months), while pair 5086/5527 showed the shortest OS (23 months) and PFS (16 months). (D) The PLS-DA identified 15 further metabolites (on top of dashed blue line) with variable importance in projection (VIP) scores > 1 that contribute significantly to the PLS-DA model. m, months.

