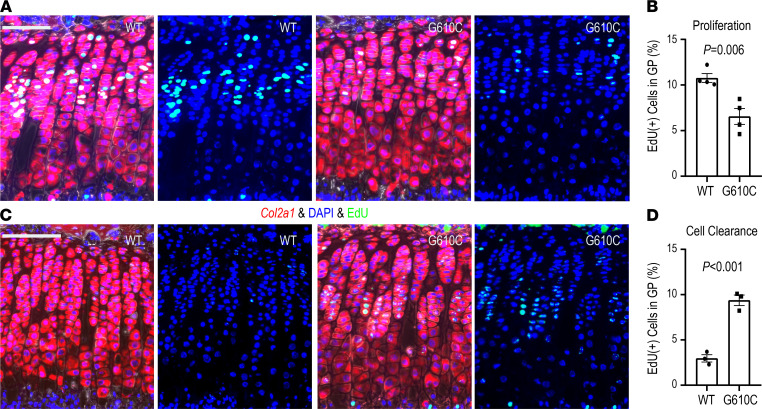
Figure 1. Cell turnover in the growth plate is significantly reduced in G610C OI mice.
(A) Representative images of EdU staining combined with in situ hybridization for Col2a1 in the growth plate from G610C OI mice (G610C) and WT littermates (WT) 24 hours after EdU administration (red, Col2a1; green, EdU; and blue, DAPI). Scale bar: 100 μm. (B) Percentage of EdU-labeled chondrocytes in the growth plate (n = 4 mice per group, P = 0.006, 2-tailed Student’s t test). (C) Representative images of EdU staining combined with in situ hybridization for Col2a1 in the growth plate 4 days after EdU administration (red, Col2a1; green, EdU; and blue, DAPI). Scale bar: 100 μm. (D) Percentage of EdU-positive chondrocytes in the growth plate (n = 3 mice per group, P < 0.001, 2-tailed Student’s t test). Data are shown as mean ± SEM.

