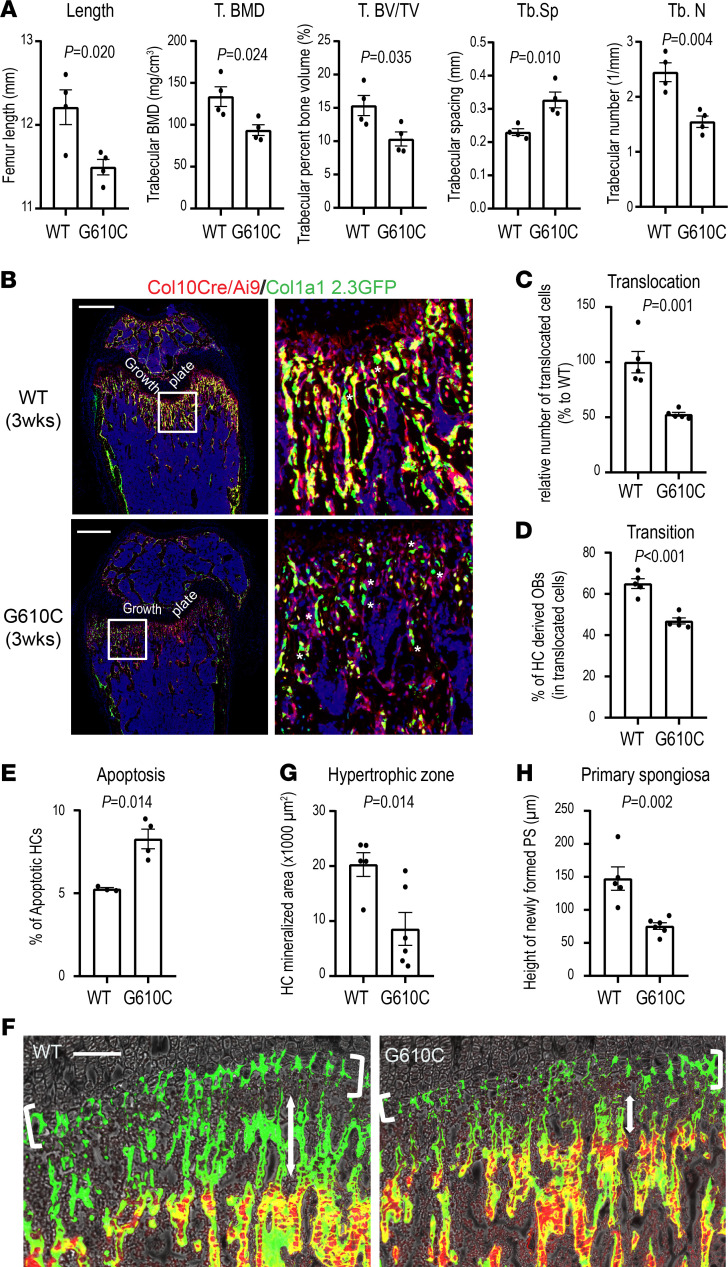
Figure 2. Hypertrophic chondrocytes stagnate in the growth plate in G610C mice.
(A) μCT analysis of femora from female G610C OI mice and female WT littermates at 3 weeks of age (n = 4 mice per group, 2-tailed Student’s t test). (B) Representative images of femoral sections from Col10a1-Cre;Ai9;Col1a1 2.3-GFP and Col10a1-Cre;Ai9;Col1a1 2.3-GFP;G610C mice at 3 weeks of age. The white boxes are enlarged in the right panels. Green osteoblasts are indicated by white asterisks. Scale bars: 500 μm. (C) Percentage of HC-derived cells (red + yellow cells) in the trabecular area relative to those in Col10a1-Cre;Ai9;Col1a1 2.3-GFP mice in B (n = 5 mice per group, P = 0.001, 2-tailed Student’s t test). (D) Percentage of HC-derived osteoblasts (100% × [yellow cells]/[red + yellow cells]) in the trabecular area in B (n = 5 mice per group, P < 0.001, 2-tailed Student’s t test). (E) Percentage of TUNEL-positive apoptotic cells in HCs (WT, n = 3 mice; G610C, n = 4 mice; P = 0.014; 2-tailed Student’s t test). (F) Representative images of the tibial growth plate/primary spongiosa area labeled with calcein and alizarin red. Scale bar: 100 μm. (G) Quantification of mineralized area in the hypertrophic zone indicated by white brackets in F (WT, n = 5 mice; G610C, n = 6 mice; P = 0.014; 2-tailed Student’s t test). (H) Height of newly formed primary spongiosa during the interval between calcein and alizarin red injections (47 hours) indicated by double arrows in F (WT, n = 5 mice; G610C, n = 6 mice; P = 0.002; 2-tailed Student’s t test). Data are shown as mean ± SEM.

