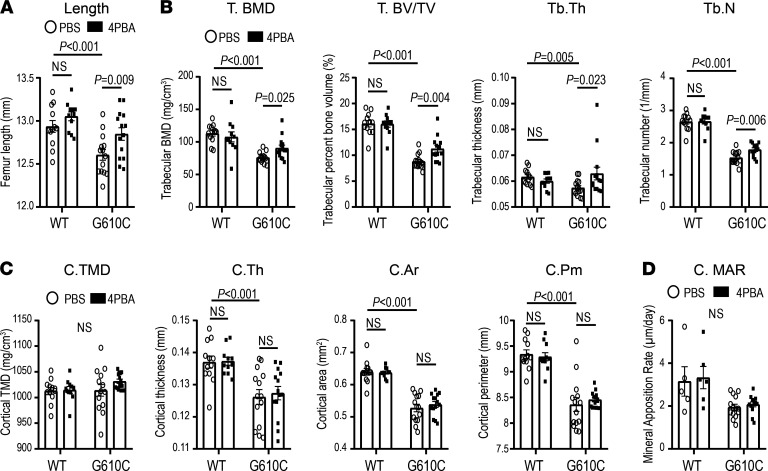
Figure 4. Four-week treatment with 4PBA improves bone length and trabecular bone formation in female G610C OI mice.
(A–C) Femur geometry (μCT) in female G610C OI mice and female WT littermates (WT) treated by daily injections of PBS (circle dots) or 0.4 mg 4PBA in PBS (filled square dots) for 4 weeks (WT + PBS, n = 12; WT + 4PBA, n = 11; G610C + PBS, n=14; G610C + 4PBA, n = 14). (A) Femur length (2-way ANOVA; treatment-genotype interaction, P > 0.1). (B) Trabecular bone mineral density (T. BMD; 2-way ANOVA; treatment-genotype interaction, P < 0.05), trabecular bone volume fraction (T. BV/TV; Mann-Whitney U test), trabecular thickness (Tb. Th; Mann-Whitney U test), and trabecular number (Tb. N; 2-way ANOVA; treatment-genotype interaction, P < 0.1). (C) Cortical tissue mineral density (C. TMD; 2-way ANOVA; treatment-genotype interaction, P > 0.1), cortical thickness (C. Th; 2-way ANOVA; treatment-genotype interaction, P > 0.1), cross-sectional area (C. Ar; 2-tailed Student’s t test) and perimeter (C. Pm; 2-tailed Student’s t test). (D) Mineral apposition rate (MAR) at posterolateral periosteal surface (mid-diaphysis) per day (2-tailed Student’s t test). Data are shown as mean ± SEM. Mann-Whitney U or 2-tailed Student’s t test was used instead of 2-way ANOVA in B–D because of failure of normality or equal variance tests, respectively.

