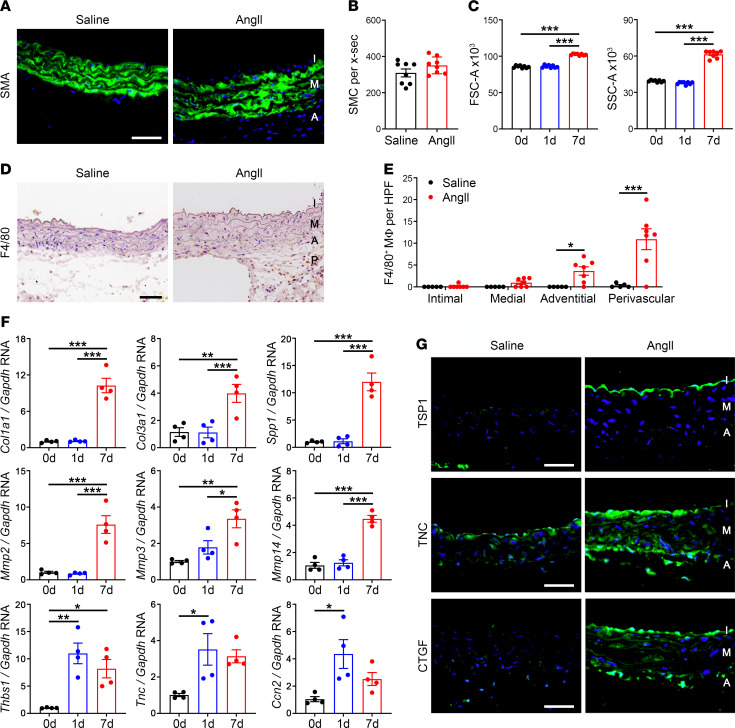
Figure 4. Medial thickening results from SMC hypertrophy and ECM accumulation.
Apoe–/– mice were infused with saline or AngII and the suprarenal abdominal aortas were analyzed after 0–7 days. (A) Immunofluorescence microscopy for SMA expression (green) with DAPI-labeled nuclei (blue) at day 7, scale bar: 50 μm. (B) Number of SMCs per cross section (x‑sec) extrapolated from counts of medial nuclei after 7 days (n = 8). (C) Flow cytometry for forward (FSC-A) and side (SSC‑A) scatter area of enzymatically isolated SMA+ SMCs at 0, 1, and 7 days (n = 8). (D) Immunostains for F4/80+ cells in intima (I), media (M), adventitia (A), and perivascular tissue (P) at 7 days, scale bar: 50 μm. (E) Number of F4/80+ macrophages (M) in vascular wall layers at 7 days (n = 5–7). (F) Quantitative RT-PCR for selected transcripts regulating ECM synthesis and degradation, namely Col1a1, Col3a1, Spp1 (encoding osteopontin), Mmp2, Mmp3, Mmp14, Thbs1, Tnc, and Ccn2 (encoding CTGF) at 0, 1, and 7 days (n = 4). (G) Expression of thrombospondin-1 (TSP1), tenascin-C (TNC), and CTGF (green) with DAPI-labeled nuclei (blue) at 7 days, scale bars: 50 μm. Individual data shown, bars represent mean ± SEM, *P < 0.05, **P < 0.01, ***P < 0.001, unpaired, 2-tailed t test (B), 1‑way ANOVA with Tukey’s multiple-comparison test (C and F), and 2-way ANOVA with Sidak’s multiple-comparison test (E).

