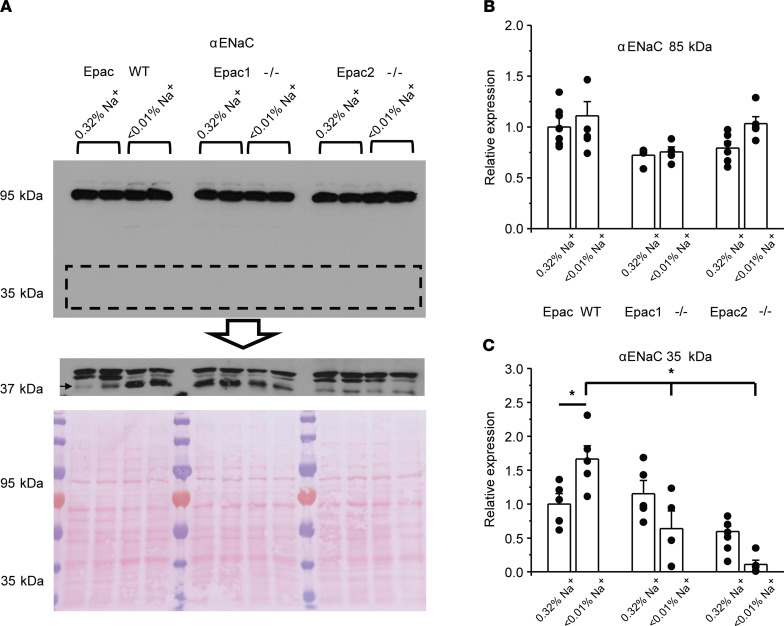
Figure 4. Defective renal αENaC processing in mice lacking Epac isoforms.
(A) Representative Western blot from whole kidney lysates of Epac WT, Epac1–/–, and Epac2–/– mice kept on regular (0.32% Na+) and sodium-deficient (< 0.01% Na+) diets probed with anti-αENaC antibodies using low sensitivity (top panel) and high sensitivity (middle panel) chemiluminescence kits. Signal around 95 kDa corresponds to full-length αENaC and signal around 37 kDa reflects cleaved αENaC form (showed with an arrow). The Ponceau red staining of the same nitrocellulose membrane demonstrating equal protein loading is shown on the bottom panel. (B and C) Summary graphs comparing full-length and cleaved forms of αENaC expression in Epac WT, Epac1–/–, and Epac2–/– mice under conditions in A. Each measurement represents an individual mouse. The intensity values were normalized to the total signal of the respective lines in Ponceau red staining. *P < 0.05 between experimental groups shown with a line on the top; 1-way ANOVA with post hoc Tukey test was used.

