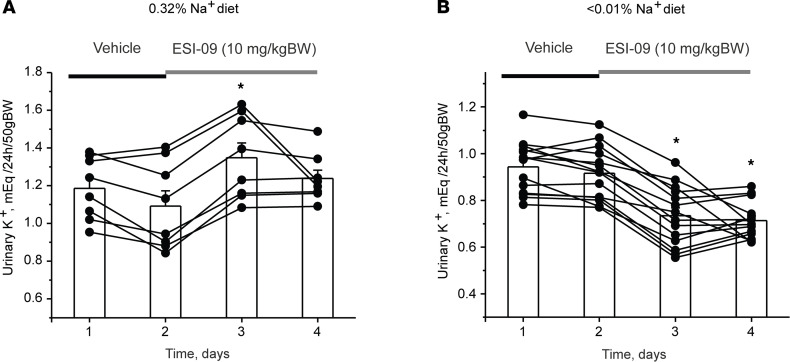
Figure 9. Opposite effects of Epac blockade with ESI-09 on urinary levels of K+ in mice kept on regular and sodium-deficient diets.
The summary graphs show a time course of changes in 24-hour urinary K+ levels in Epac WT mice kept on (A) regular (0.32% Na+) and (B) sodium-deficient (< 0.01% Na+) diets upon daily injections of the combined Epac1&2 blocker ESI-09 (10 mg/kgBW) or vehicle as indicated with black and gray bars, respectively. Connected dots represent consecutive measurements from the same animal. *P < 0.05 versus vehicle; 1-way repeated ANOVA with post hoc Bonferroni test was used.

