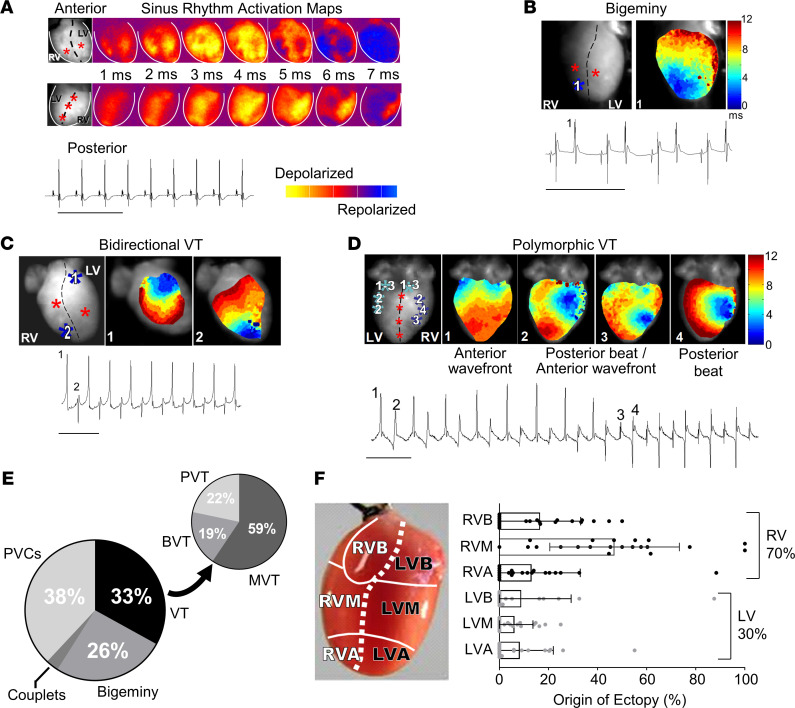
Figure 2. Ex vivo optical mapping and continuous ECG recording in Langendorff-perfused Casq2 null mouse hearts.
(A) ECGs were continuously recorded while optical voltage maps were acquired from anterior and posterior epicardial surfaces during sinus rhythm. Sinus rhythm epicardial breakthroughs are denoted by red stars in the left-most panel. (B) Example temporal activation maps and associated ECG traces of bigeminy; (C) bidirectional VT; and (D) polymorphic VT after perfusion of a 100 nM ISO bolus. Ectopic foci are denoted by blue stars and indicated numerically on the accompanying ECG traces. (E) Classification of arrhythmia episodes from 8 hearts captured by ECG and optical mapping (n = 246 total episodes). BVT, bidirectional VT; MVT, monomorphic VT; PVC, premature ventricular contraction; PVT, polymorphic VT. ECG scale bars: 500 ms. (F) Quantification of the site of epicardial breakthroughs (n = 21 for each group) during voltage mapping from the same recordings as in E. Data reported as mean ± SD. R/LVB, right/left ventricular base; R/LVM, mid right/left ventricle; R/LVA, right/left ventricle apex.

