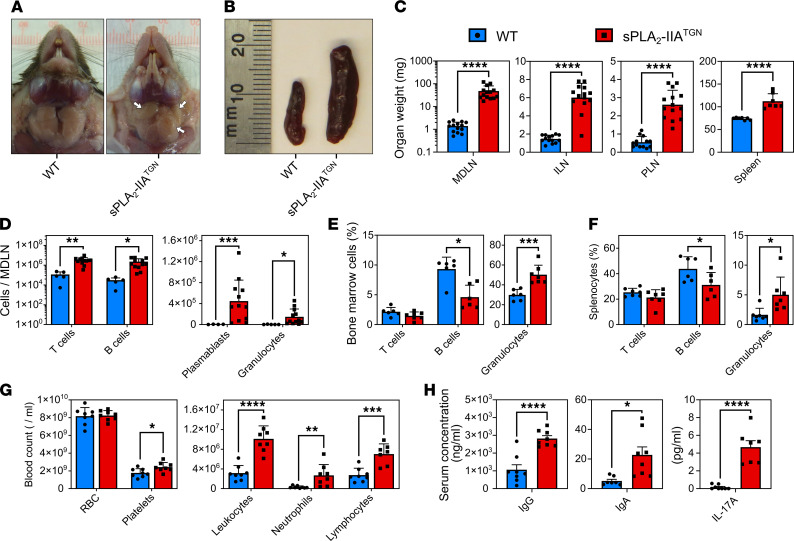
Figure 1. Spontaneous induction of immune disturbances in sPLA2-IIATGN mice.
(A and B) Representative mandibular lymph nodes (MDLN, white arrows) and spleen of 8-month-old WT and sPLA2-IIATGN mice housed in a SPF animal facility (n = 8). (C) Weight of MDLNs (n = 14), inguinal lymph nodes (ILN, n = 14), popliteal lymph nodes (PLN, n = 13–14), and the spleen (n = 7) from both mouse groups. (D–F) Flow cytometric analysis with markers targeting T cells (CD3+B220–), B cells (B220+CD3–), plasmablasts (CD19+CD138+), and granulocytes (Gr1+). (D–F) Cell counts are represented for MDLNs (n = 5 WT and 12 sPLA2-IIATGN), and cell proportions are represented for the BM (n = 6–7) and spleen (n = 6–7) of 8-month-old WT and sPLA2-IIATGN mice. (G) Blood composition of both mouse groups determined by complete blood count (n = 8). (H) Quantification of type G (IgG) and type A (IgA) immunoglobulin by ELISA (n = 8) and IL-17A by cytometric bead array (n = 7–8) in the serum of WT and sPLA2-IIATGN mice. Data from 7 separate experiments are presented as mean ± SEM. Statistical analysis involved unpaired t test. *P < 0.05, **P < 0.01, ***P < 0.001, ****P < 0.0001.

