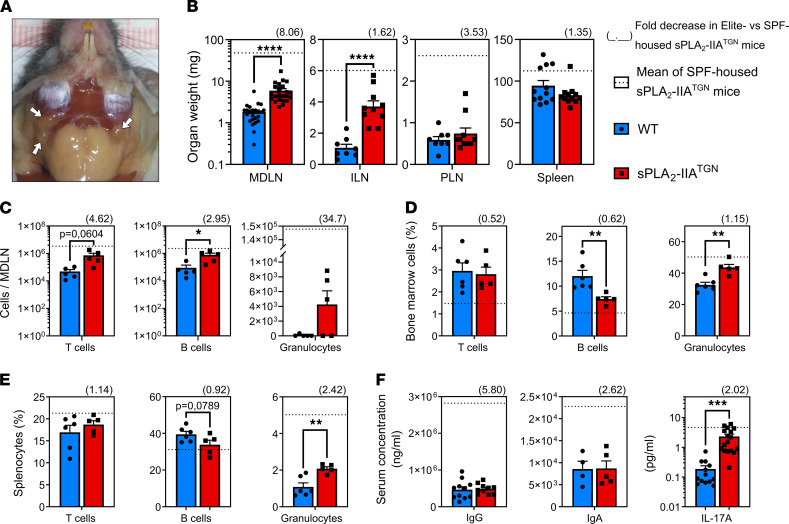
Figure 3. Impact of the housing environment on the immune phenotype.
WT and sPLA2-IIATGN mice were housed in an Elite SPF+ animal facility for 14 months before the severity of the immune phenotype was assessed. (A) Representative mandibular lymph nodes (MDLN, white arrows) of sPLA2-IIATGN mice (n = 12). (B) Weight of MDLNs (n = 24), ILNs (n = 8–10), PLNs (n = 8–10), and spleen (n = 12) of both mouse groups. (C–E) Flow cytometric analysis with markers targeting T cells (CD3+CD19–), B cells (CD19+CD3–), and granulocytes (Gr1+). (C–E) Counts are displayed for MDLNs (n = 5), and the proportion of each cell type is displayed for the BM (n = 5–6) and spleen (n = 5–6) of WT and sPLA2-IIATGN mice. (F) Quantification of IgG (n = 10–11) and IgA (n = 5) by ELISA and IL-17A (n = 13–17) by cytometric bead array in the serum of WT and sPLA2-IIATGN mice. (B–E) Fold decrease of sPLA2-IIATGN mice housed in the Elite environment compared with sPLA2-IIATGN mice housed in the SPF animal facility is represented as a number in parentheses over each graph. Dotted line represents mean of sPLA2-IIATGN mice housed in the SPF animal facility (see Figure 1). Data from 3–4 separate experiments are presented as mean ± SEM. Statistical analysis included unpaired t test. *P < 0.05, **P < 0.01, ***P < 0.001, ****P < 0.0001.

