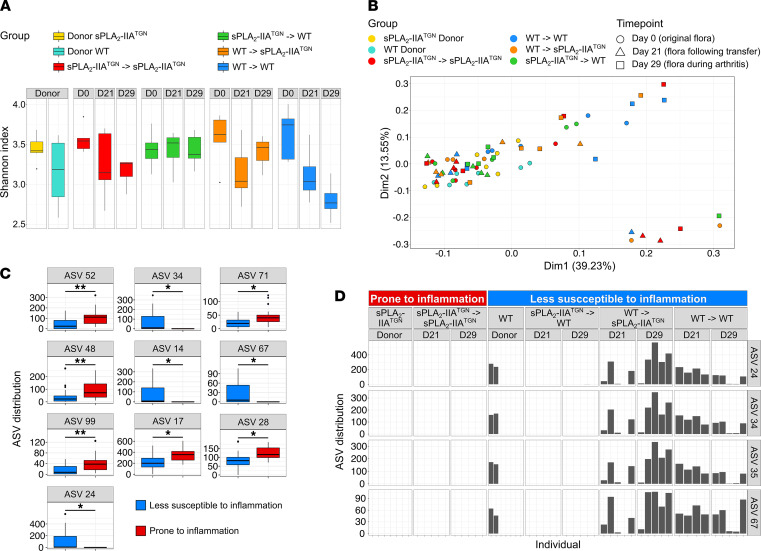
Figure 6. Mice with enhanced arthritis susceptibility present limited microbiota alterations.
The fecal microbiota of donor and recipient mice involved in the fecal microbiota transplantation was sequenced at 3 different time points: before the transplantation (D0), 10 days following the transplantation (D21), and 8 days following the induction of arthritis (D29). (A) α-Diversity (Shannon index) of the microbiome of each mouse group at every time point (n = 5–7). (B) Principal component analysis based on the Bray Curtis dissimilarity comparing the flora from all mouse groups. (C and D) Groups were organized into 2 categories depending on their susceptibility to induced arthritis: sPLA2-IIATGN donors and sPLA2-IIATGN mice receiving the flora from sPLA2-IIATGN donors were classified as “Prone to inflammation,” and WT donors, WT recipients, and sPLA2-IIATGN mice receiving the WT flora were labeled “Less susceptible to inflammation.” (C) Distribution of amplicon sequence variants (ASV) differentially modulated between categories. (D) Distribution of differentially enriched ASVs found only in WT donors and their recipient mouse groups within every mouse. Bacterial species with highest percentage of identity for each differentially enriched ASV are as follows: ASV 52, Ruminococcus bromii (99%); ASV 48, Vallitalea promyensis (87%); ASV 99, Anaerobacterium chartisolvens (88%); ASVs 24, 34, and 35, uncultured Muribaculum species (100%); ASV 17, Muribaculum intestinale (91%); ASV 71, Pseudoflafonifractor phocaeensis (89%); ASV 67, Uncultured Muribaculum specie (96%); and ASV 28, Muribaculum intestinale (92 %). Data are presented as boxes representing the median and quartiles, with whiskers extending up to 1.5 interquartile range. Statistical analysis included Welch’s t test with P value corrected by Benjamini-Hochberg FDR procedure. Percentage of identity represent the percentage of similarity to the closest known sequence (Blastn using RefSeq NT). *P < 0.05, **P < 0.01.

