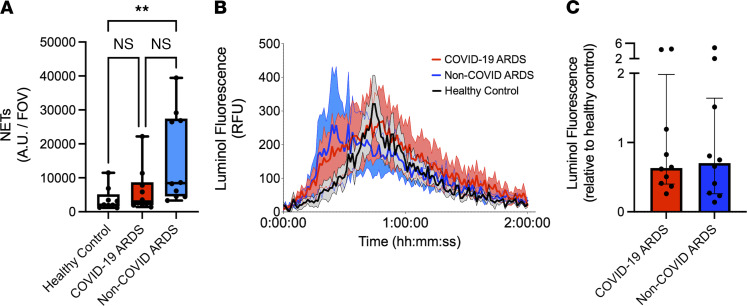
Figure 4. Neutrophil priming is not induced by inflammatory mediators in plasma.
(A) Ex vivo imaging of NET release quantified as NET area per field of view from neutrophils from healthy volunteers incubated with plasma of healthy controls (n = 9), patients with COVID-19 ARDS (n = 10) and patients with non-COVID ARDS (n = 10). Dots represent individual patients, bars represent median, and whiskers represent the range; **P < 0.01 by Kruskal-Wallis test with post hoc Dunn’s test. (B and C) ROS production by neutrophils detected by luminol fluorescence assay shown by (B) relative fluorescence units (RFU) and (C) AUC of luminol fluorescence following stimulation of healthy donor neutrophils with plasma from patients with COVID-19 ARDS (n = 10) or patients with non-COVID ARDS (n = 10) relative to healthy control plasma. Dots represent individual patients, bars represent median, and whiskers represent the range.

